Accelerating Toward Net Zero and 45Z in Biofuels
The Guide to Low CI Biofuels With Regeneratively Grown Feedstocks
Download the Guide
Download the Guide
In July of 2021, the Renewable Fuels Association, representing over 150 of the largest corn growers, biofuels producers, co-ops and big ag companies, sent a letter to U.S. President Joe Biden outlining their commitment to achieving a net-zero carbon footprint by 2050 or earlier. Additionally, most independent producers, including all of the Renewable Fuels Association membership, have signed a pledge to be at a 70% Carbon Intensity discount to gasoline by 2030.
According to energy and ethanol industry leaders, “The future of ethanol will be based in low-carbon farming including reductions in farming energy, fertilizer, and N2O emissions as well as soil carbon sequestration.”1 For this reason, understanding the intersection between regenerative agriculture, carbon farming and ethanol corn production is important. The entire lifecycle of ethanol is a promising area for decarbonization, and it all starts with how the feedstock is grown.
The science is clear. U.S. Department of Energy-supported studies have found that:
A reduction in the overall carbon intensity of a crop-based biofuel can be achieved by cutting down the CI of the biofuel’s feedstock, which in turn correlates significantly to agricultural management practices. Proposals are being made to incentivize low-carbon biofuel feedstocks under U.S. fuel regulatory programs to promote sustainable farming practices by individual farms. For such an incentive scheme to function properly, robust data collection and verification are needed at the farm level.2

The U.S. is rapidly scaling up its sustainable aviation fuel (SAF) production capacity. According to a new report, The U.S. is far in front of the rest of the world for projected SAF production. “…the US [is] forecast to have an upcoming capacity of more than 1,200 million gallons per year by 2030.”3 While SAF can be produced from a variety of feedstock sources, SAF from ethanol is critical in order to achieve SAF climate goals. The Inflation Reduction Act creates incentives for SAF which will also include ethanol.
“[U.S. President] Biden sought to kickstart SAF production with a $1.25 per gallon production tax credit in the IRA. To be eligible for the credit, SAF producers must demonstrate their fuel is 50% lower in emissions than conventional jet fuel….Under a Biden administration blueprint shared this year, some 10% of the 2030 SAF target is projected to come from ethanol. Biden’s public statements have been more optimistic about the role of ethanol in the SAF program. “‘Mark my words: the next 20 years, farmers are going to be providing 95% of all the sustainable airline fuel,’” he said in July at a Maine rally. …ethanol must be a key ingredient if the SAF program is to hit its targets, said Barry Glickman, a vice president at Honeywell, an investor in some U.S. biofuel plants. “If we cannot use U.S. ethanol, then there will be a shortage of SAF,” he said.4
When it comes to ethanol, the U.S. is the leading producer in the world. Thus, both the carbon intensity and the production pathways for ethanol and SAF both start in the same farm fields.
The U.S. is the leading producer of ethanol in the world, and the overwhelming majority of U.S. ethanol comes from corn.
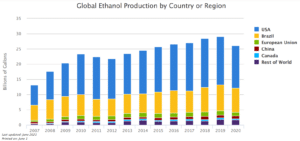
Source: U.S. Department of Energy Alternative Fuels Data Center5
In 2020, more than 33% of all U.S. corn was used for ethanol production. The trend has been growing as U.S. ethanol production continues its overall growth trajectory. While the global COVID-19 pandemic depressed corn and ethanol production and consumption in 2019 and 2020, subsequent years show a rebound, and continued growth is expected. In 2023, 5.3bn bushels, or approximately 35% of the US corn harvest by the USDA to go into ethanol production.6
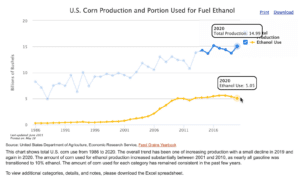
Source: United States Department of Agriculture7
While ethanol can be produced from various sources like sugarcane and corn, we are specifically considering corn and corn stover/cellulose in this paper.
With the goal of reducing net carbon emissions from biofuel production, it is important to consider both the carbon intensity of ethanol and the full life cycle of both SAF and ethanol. Carbon intensity (CI) is the amount of carbon by weight emitted per unit of energy consumed.8
The lifecycle of ethanol based SAF and corn-based ethanol starts on the farm. It considers farming practices, the carbon footprint of inputs like fertilizers and pesticides, the fermentation processes that convert corn to biofuel, and the transportation, distribution, and combustion of ethanol in commercial and consumer vehicles.
Work by the US DOE and Argonne National Labs (ANL) has been completed to determine if ethanol based SAF will be able to reach GHG reduction targets set out by the US Government. Scientists at ANL performed a lifecycle analysis of the corn to ethanol to jet fuel pathway. They used the GREET model (also developed by ANL) for calculating carbon intensity at each stage of the SAF production pathway. The GREET model covers, “… the entire ETJ pathway including corn farming, corn ethanol refining, jet fuel upgrading, and fuel transportation and consumption.”9 The results show clearly that there are two major sources of GHG and carbon intensity in the pathway.
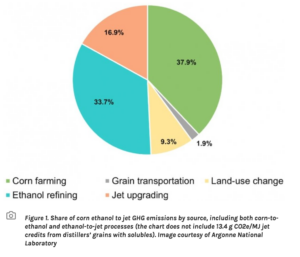 10
10
The biggest areas of GHG emissions in the pathway are corn farming, followed by the ethanol refining. This means that in addition to carbon capture and storage at the ethanol refining facilities, reducing the GHG emissions and CI impact of feedstock farming will have the biggest impact on accelerating towards the netzero goals for biofuels set by the U.S. government.
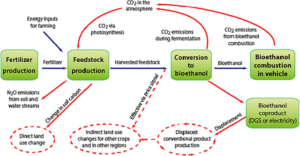 6
6
According to the most recently published research from the U.S. government, the CI of corn ethanol is 51.4g of CO2e per MJ-1.12 Of note is that this CI is 46% lower than the CI of pure gasoline.13
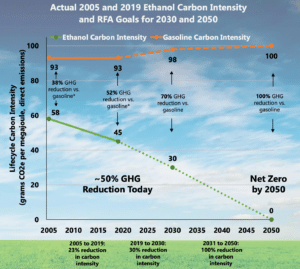 14
14
Even with this promising measurement, even greater improvements can be made in lowering the CI of ethanol through scaling the adoption of carbon farming and carbon sequestering practices on the farms producing corn for ethanol. By reducing the CI of corn going into ethanol production, the overall CI of ethanol is decreased. Similarly, the carbon footprint of ethanol-corn farming is decreased while the regenerative practices that lead to this increase accrue additional, stacked benefits for the soil, yield and even overall profitability of the farm.
After the actual fermentation and production of the ethanol at the processing facility, farming practices are the largest contributor to the overall carbon intensity of ethanol.15 Because of this, the time and market conditions are very good to support the adoption of regenerative agriculture practices and programs that increase soil-based carbon sequestration in corn farming, especially for those growers producing corn destined for ethanol production.
It is to these specific farming practices that we now turn our attention.
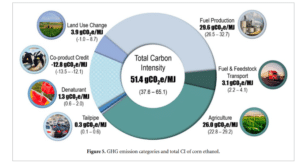 16
16
Regenerative farming practices improve soil quality, create climate-resilient crops and land, and increase on-farm profitability over time. In addition to these business-of-farming-benefits, regenerative farming practices are also proven to reduce and avoid greenhouse gas (GHG) emissions and sequester carbon in the soil. All of these practices combine to reduce the carbon footprint of farming and reduce the carbon intensity of the crop being grown.
In the midwest and corn belt of the United States, regenerative farming practices—especially when switched from conventional practices—have an outsized positive impact on soil carbon and GHG emissions reduction.
While practices are varied, they are generally accepted to include crop rotations, cover cropping, no-till or conservation tillage, reduced chemical and reduced fertilizer inputs.
Carbon sequestration is highly related to soil and management systems. Research on the impact of tillage practices and crop rotation has demonstrated that no-till and permanent vegetation are more effective in storing carbon in the soil. The use of crop rotation and conservation tillage, in addition to effective manure and nitrogen management systems, contributed significantly to improving soil carbon status. The value of storing carbon through conservation practices is significantly improving soil quality and productivity as listed earlier. (Emphasis added.)17
By implementing and increasing regenerative agricultural practices, growers are able to decrease the carbon footprint and carbon intensity of ethanol-bound corn. At the same time, they are able to increase on-farm profitability, yield and soil-based carbon sequestration.
The degree of carbon intensity decrease will necessarily vary with the condition of the soil, weather, farming practice choices and even the kind of crops being grown.
The science is clear: Adopting regenerative farming practices creates a sizable and quantifiable decrease in the carbon intensity of ethanol-bound corn.
Carbon intensity (CI) is calculated as grams of carbon per megajoule of energy provided by ethanol.
Full field-to-fuel lifecycle analysis of the CI of ethanol has found that the agricultural impact is 26gCO2e/MJ18, or about 50% of the total impact.
Before we can see how much a farm implementing regenerative practices can reduce the CI of ethanol produced from their corn, we must first perform some conversions. Specifically, we are interested in converting grams of carbon per megajoule to grams of carbon per bushel. Then we can compare the CI of a bushel of corn under conventional practices to that of a bushel of corn under regenerative practices. Finally, we can convert that new regenerative corn CI to its contribution to the CI of ethanol produced from that bushel.
It is important to state that, for the purposes of this paper, it is assumed that the CI of ethanol calculated by Scully et al is from conventionally, not regeneratively grown corn. Scully acknowledges this in and accounts for conventional practices that already improve GHG emissions and SOC (soil organic carbon storage).
The downward trend of corn production emissions is explained by improvements in farming practices and LCA methods. . . . Farm energy use decreased by approximately 8% on a per bushel basis from 2005 to 2010,. . . The GREET model used to characterize farming emissions has also improved to quantitatively account for soil organic carbon, which tends to lower GHG emissions from corn farming. . . GHG emissions associated with farming practices net of co-product credit constitute a relatively large share (26%) of the total CI for corn ethanol, therefore, additional improvements that reduce the cradle-to-gate footprint of corn production would improve the CI of corn ethanol further.19 (Emphasis added.)
The CI of conventional farming corn for ethanol is approximately 1 tonne/acre. We can derive this value from the studies above and some basic math. From above, we remember that the CI of agricultural practices of ethanol corn is 26 gCO2e/MJ. According to the IAEA, the energy density of Ethanol is 21 MJ/l20. Converting this to energy density per gallon, we get 79.86 MJ/gallon.21 This allows us to restate the CI of agricultural practices for ethanol as 2,076.36 gCO2e/gallon. The USDA Bioenergy group tell us that you get 2.7 gallons of ethanol per bushel of corn.22 This allows us to put the CI in terms of bushels: 5,606.17 gCO2e /bushel. In 2021, the USA averaged 177 bu/ac of corn. Some states, like Illinois and Iowa, saw harvests above 200 bu/ac.23 Stating CI now in terms of acreage, we get: 992,292.44 gCO2e/acre. This is equivalent to .992292 metric tonnes of CO2e/acre or just under 1 tonne per acre.
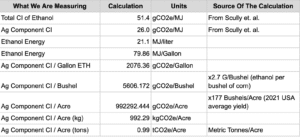
This CI value is what we seek to reduce through regenerative farming practices on fields and farms growing ethanol corn. It should be noted that this calculation contemplates only corn yield, not stalk or stover or other parts of the corn plant that can be used for ethanol production.
Additionally, when it comes to calculating and quantifying CI in agriculture, the unique characteristics of each parcel play a very important and interlocking role. Soil types, soil biology, geography, elevation, practice choices, inputs, and weather all interact in complex ways. CIBO Technologies has developed a proprietary platform that uses advanced mechanistic crop modeling, satellite-based computer vision and detailed ground-truth data to quantify the impact different farming practices have on CI, yield, CO2e sequestration, Nitrogen fixation and flux, as well as many other factors. In this way, CIBO Technologies is able to deliver highly accurate, trusted and detailed insights on carbon intensity, carbon footprint, and regenerative potential of any farm, field, region or parcel in the U.S.
In short, every field will vary. Unsurprisingly, Iowa is the state that produces the most ethanol and ethanol corn. For the purposes of this paper, and using the CIBO Technologies platform, we randomly selected a field in Iowa to use as our archetypal example. This Iowa corn field was 582 acres. The CIBO platform and CIBO CarbonLab™ performed a future-looking what-if calculation for CI for this field under a regenerative management practice scenario. No-till, crop rotation, cover cropping, planting dates, reduced nitrogen application and predicted diesel usage were modeled using the CIBO SALUS crop model. CIBO uses ensemble weather predictions for the 2023 growing season.
CIBO found that, under a regenerative practice model, the total CI for ethanol being made from this field could be reduced by over 28%, due to the agricultural component of the CI being reduced by more than 50%! Let’s explore the math.
CIBO CarbonLab found that under a regenerative practice regime, the field’s carbon intensity would be .56 tCO2e/ac. Now we subtract this from the average CI for ethanol corn farming practices researchers calculated above and get .43 tCO2e/ac.24 This represents the new, lower carbon intensity of agricultural practices for the farming of corn, from this field, that will be converted into ethanol. From this point, we back-convert from tonnes per acre to grams per MJ to retrieve the new metric that we can compare to the original lifecycle CI for ethanol agriculture. We get 432,292 gCO2e/acre. Converting acres to bushels, we get 2,442.3 gCO2e/bu. Then from bushels to gallons we get 904.47 gCO2e/gallon. Once we have CI by gallons of ethanol, we can easily convert back to CI per megajoule. The agricultural portion of the CI for ethanol goes from 26 gCO2e/MJ to 11.3 gCO2e/MJ.25 This means that adopting new regenerative farming practices leads to a reduction of over 14 gCO2e/MJ, or more than 56% of the original agricultural carbon intensity at least for this field. Adopting these processes takes the total CI from field-to-fuel from 51.4 gCO2e/MJ to 36.7 gCO2e/MJ.
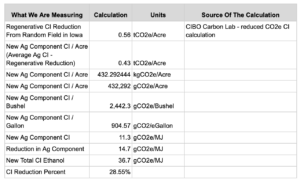
In total, regenerative agriculture practices can lead to a total CI reduction of more than 28%, at least for this one farm. As mentioned earlier, some fields and farms will experience greater reduction and some will experience smaller reductions.
Of course, practice changes in other areas of the ethanol production process and supply chain can further reduce the overall CI of ethanol. However, the massive impact of such a CI reduction from a switch to regenerative farming practices cannot be understated. Furthermore, stacked benefits of regenerative practices create additional incentives for adoption, from greater climate resilience to increased yields.
This field-level detail is very important for ethanol production plants. Such visibility at the parcel, field and farm level is vital if production facilities that buy corn directly from local growers are to reliably quantify the carbon intensity of the fuel they produce. It is also critical to ensure growers can command higher premiums for lower carbon corn.

This image shows a supply shed. Supply shed analytics help organizations across all industries make better, faster and more informed decisions about their business operations. A deep supply shed analysis can help ethanol producers identify, invite, monitor and verify regenerative agriculture practices that reduce the carbon intensity of corn destined for the production facility in the center of the circle.
Current models, such as the GREET model, Soil Carbon Emission Calculator and Carbon Calculator for Land Use Change from Biofuels Production, developed by Argonne National Labs are used by most in the biofuels industry to calculate the lifecycle CI of ethanol. CIBO Technologies’ CIBO Impact platform supports the GREET model along side the other ecosystem models supported by the platform. The US Government has stated that the GREET model is valid for reporting CI scores of SAF for 40b and 45z tax incentives enacted by the Inflation Reduction Act. This includes the CI of the feedstocks going into the biofuels that are further refined into SAF.
CIBO Technologies delivers GREET CI and even higher resolution visibility for parcel, field, farm, and supply shed CI quantification. These are critical for accurate CI quantification for each production facility as well as for accurate labeling and premium payouts.
For ethanol production plants, purchasing low carbon corn with proven carbon intensity is important. Nationally, 62% of corn comes from local growers near the production plants. However, some plants source as much as 95% of their corn from local growers.26 In Iowa, the state’s 41 ethanol plants consume 60% of the state’s corn crop.27 In Ohio, the state’s 7 ethanol plants consume 33% of that state’s corn.28 This goes to show that local sourcing accounts for the vast majority of ethanol corn. If a local ethanol plant is on a mission to create low carbon ethanol, it is imperative that they have detailed, field-level visibility into the CI of yields they are purchasing and storing from the growers from whom they source. With detailed CI reporting and certification from source fields and yields, ethanol producers are able to combine low CI corn with their own CI-reducing processes and CO2 reclamation to gain competitive advantage in the emerging low-and-no-carbon ethanol markets. This is precisely an area where advanced, scaled technology can help. CIBO Technologies delivers certification for regeneratively grown grains that quantifies and certifies carbon footprint, carbon intensity and yield for each year.

Incentives are needed to drive adoption of regenerative farming practices that produce low carbon intensity corn for ethanol and SAF. Despite growing demand for low carbon ethanol, federal incentives for regenerative agriculture and a growing corpus of evidence that regenerative practices like cover cropping, no-till and input reduction all lead to greater farm profitability and climate resiliency, adoption of regenerative practices is low. Reasons for low adoption abound, from processes and paperwork that is incredibly bureaucratic and burdensome to growers; to a lack of meaningful incentives; to uncertainty over how changing from a tried-and-true conventional practice to new regenerative practices will affect the annual bottom line of farmers who operate on already-thin margins.29
According to one recent study:
While the soil health and water quality benefits that cover crops provide are well established, the financial case for cover crop adoption is much less clear. Economists generally agree that, at least in the short run (first 5 years), the costs associated with cover crops are higher than the direct benefits to the producer (e.g., Plastina et al., 2018, Thompson et al., 2020). Therefore, more educated producers may be placing additional scrutiny on the economic case for cover crop adoption, which may be limiting the extent of their adoption.30
The story is repeated again and again for other regenerative practices, from conservation tillage to inputs reduction to crop rotation and soil, water and biodiversity management. While the ability to sequester carbon in the soil is well established, nature-based processes are not short-term fixes. Many practices have to accumulate carbon over time and slowly build up SOC stocks. Regenerative practices that sequester and avoid carbon are constantly fighting to pull down more CO2e than is respirated back out into the atmosphere from natural, bio-dynamic processes. After all, the soil is alive and living systems ebb and flow. In short, there is no one-time or quick-carbon-fix when it comes to agriculture. Even still, agriculture holds an important role in contributing to the decarbonization of the atmosphere and reducing the CI of products like ethanol. This role comes up against the annual realities of farming and the commodity-centric markets that exist globally today.
For the individual farmer and land-owner, the economics of regenerative agriculture and carbon farming are a key barrier to adoption. Regenerative practices that increase yields, reduce erosion and improve water retention in the soil after 5 years may also reduce yields in the short term. They may also require capital investments in the form of new equipment, additional seeds and additional fuel. Most federal and state programs that aim to incentivize farmers to adopt or continue regenerative practices either fail to cover the cost of transition, are set up as reimbursements which delay the farmer’s ability to recoup costs in a timely manner, or are so laden with bureaucratic paperwork that the burden on the farmer to enroll is so onerous and overwhelming that they simply opt out.
For this reason, incentives are needed that engage farmers. Effective incentives require a keen awareness of how farming operates, pay directly for verified adoption of practices as well as for carbon outcomes, and make it easy for growers and landowners to enroll and engage.
When it comes to ethanol, the lack of incentives from the fuel industry to invite a switch over to regenerative practices is a key challenge. Incentives could be policy- and pricing-based, as recommended by the American Coalition for Ethanol, Kansas Corn, and South Dakota Corn Cooperatives in a recent open letter to the creators of the GREET tool (noted specifically below as the FD-CIC component that measures agricultural CI for ethanol) at Argonne National Labs:
The FD-CIC could help stakeholders make the case that future LCFS or clean fuel policies need to create a strong market driver to incentivize farmer adoption of practices benefiting soil health. . . Farmers could earn significant revenue if practices such as conservation tillage and nitrogen management can be quantified and credited under LCFS or clean fuel policies. To address these issues, we are working on a project to target incentives for conservation tillage, cover crops and nutrient management to farmers providing corn to two farmer-owned ethanol plants in Kansas and South Dakota. As farmers adopt these practices, we intend to quantify the gains and develop a non-proprietary verification regime to validate the GHG benefits of the practices. Our goal is to ultimately leverage the data to seek approval for crediting farmers with these practices in existing and future clean fuel policies31.
Even the U.S. federal government, through ANL, recognizes the dearth of incentives from the fuel industry for regenerative agriculture practices:
Shifting farming practices to increase SOC stock has not been incentivized by biofuel regulatory programs yet, due to the lack of protocols for monitoring this variable and the permanency issue associated with SOC (Liu et al., 2021). Without properly accounting for the impacts of SOC change, the benefits introduced by the adoption of conservation practices tied to carbon sequestration and abatement may not be adequately quantified and incentivized32.
Both the means and the opportunity exist now for incentive programs, sponsored and underwritten by the ethanol industry, that invite transition to regenerative practices that produce low CI corn for lower carbon ethanol. The remaining challenge is one of awareness, not capability. As Geoff Cooper, CEO of the Renewable Fuels Association said, “There are already technologies available to help us get [to net-zero], whether it’s carbon capture and sequestration or whether it is finally accounting properly for the carbon efficient farming practices that we know are happening in cornfields across the country.33”
CIBO Technologies has created a platform that works from soil to space. By bringing together support for the GREET model, detailed, parcel- and field-level carbon intelligence with advanced programs management and making it easy for users to engage, CIBO solves the carbon intensity challenge for ethanol, SAF, and biofuels. The good news is that now there is both an established protocol for monitoring, modeling, quantifying, verifying and reporting on SOC from agricultural processes, as well as a scaled platform that enables program development, syndication and rapid qualification and enrollment of grower-participants. The CIBO Impact application with GREET model support is precisely what the industry has been awaiting.
CIBO quantifies the CI and Regenerative Potential™ of a farm field. These are the carbon footprint of a farming operation and the carbon intensity of the yield from that field. Regenerative Potential is the amount of carbon reduction that could be realized by moving from a set of conventional practices on a field to the optimal set of regenerative practices on that field. The Regenerative Potential of a field will vary depending on the soil, location and the practices that CIBO has historically detected. The carbon footprint of a farming operation is the total CO2e impact produced by all practices that CIBO automatically detects in a given year. CIBO is able to detect what crop was planted, when it was planted, tillage type, if a cover crop was used, irrigation type and a number of other factors. CIBO combines automatic practice detection with mechanistic simulation of the actual detected crops in that field to output an accurate calculation of carbon footprint. This carbon footprint may then be combined with other parcels, fields and farms in a portfolio to see a holistic carbon footprint of all fields and farms under management. With Carbon Intensity, CIBO is able to parse the overall carbon footprint of a field in a given year into grams of CO2e per bushel of yield. In this way, the Carbon Intensity of the commodity output is able to be tracked and certified. This is especially important when considering the CI of ethanol.
CIBO is the only technology platform that combines Regenerative Potential with Carbon Footprint and Carbon Intensity to deliver complete visibility for agricultural carbon.
With remote satellite sensing, computer vision, electronic records and physical inspection, CIBO verifies farm management practices including tillage practice, nitrogen application and others. A set of fixed locational factors (soil, weather, topography, etc), and a set of variable management practices are used to measure carbon footprint. The management practices that affect carbon intensity are as follows:
All of these technological innovations are brought together into the CIBO Impact platform.
CIBO Impact supports growers, Coops, and advisors on their journey to and through regenerative agriculture. It does this by recommending and prequalifying growers and acres for available programs that incentivize regenerative practices. These programs may be funded by refineries and the biofuels industry, other feedstock retailers, or even government programs like EQIP, CRP, RCPP and climate smart programs. Combining programs that extend the financial impact of refinery and industry funded programs creates a much more attractive financial business case for farmers to adopt new, sustainable, cropping practices.
At its heart, CIBO Impact runs a powerful programs engine. For ethanol and biofuels producers, CIBO Impact is the ideal way to deploy and syndicate low carbon incentive programs to growers right in their supply sheds.
From there, CIBO Impact allows growers to:
CIBO Impact also powers the sustainability initiatives of biofuels producers.
CIBO Impact is how enterprises and organizations monitor, evaluate, verify and report on progress they are making in reducing carbon emissions and lowering carbon intensity of the yields they are purchasing, producing or supporting across their supply chain. CIBO Impact delivers automated and scaled:
The ethanol industry, and biofuels more generally, have established aggressive and voluntary targets for reduced carbon intensity in biofuels production. To achieve a 70% discount to gasoline by 2030 and Net Zero by 2050, it is imperative that on-farm activities be considered in CI scoring, and that grower incentives are sufficient to encourage rapid adoption of regenerative practices. In order to win regulatory approval of new scoring techniques, sound quantification, monitoring, verifying and reporting tools will be required. Finally, to perform these tasks at scale, mechanistic modeling and remote sensing technologies will be crucially important.
CIBO Technologies applies advanced technologies to deliver a deep understanding of agricultural systems in order to help mitigate climate change, advance food system resilience and improve grower outcomes. For ethanol producers on their journey to net-zero carbon emissions, the agricultural components of the full lifecycle carbon intensity of ethanol are important and immediate areas where detailed, field-level visibility and accuracy will achieve real, marketable and climate-impactful gains.
Engage with CIBO Technologies to learn more.
