Introduction
Agricultural carbon markets are created to provide incentives for growers to adopt “climate-smart” farming practices. These practices reduce greenhouse gas (GHG) emissions on the farm and can help soil sequester carbon. Computer models of soil carbon flux play an important part in this process: models estimate carbon change year by year, and enable growers to earn carbon credits more quickly. Allowing carbon modeling to augment or even replace some direct soil sampling lowers the cost of administering carbon and climate smart programs while making programs available to more growers.
For an in-depth discussion of agricultural carbon markets, see here.
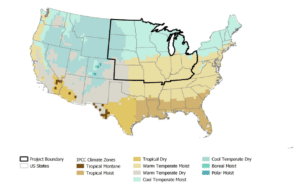
Figure 1: The geographical area of CIBO’s Verra project, showing climate zones represented.
In 2021, CIBO initiated an agricultural carbon program with Verra under the newly-issued VM0042 protocol. This program supports corn and soybean farmers in the US Midwest (see Figure 1) who adopt regenerative practices for cover crop, tillage, and nitrogen usage, using the SALUS (Systems Approach to Land Use Sustainability) ecosystem model to estimate soil carbon flux. An extensive validation of the SALUS model was required to demonstrate the accuracy, efficacy, and precision of modeled results. In this paper, we share our experience with the model validation process.

Voluntary Carbon Markets
According to the Congressional Research Service, a carbon market “…generally refers to an economic framework that supports buying and selling of environmental commodities that signify GHG emission reductions or sequestration.” With the growing awareness of greenhouse gasses’ role in climate change, many companies have committed to reducing greenhouse gas emissions. Organizations that aspire to be carbon neutral often achieve this through applying several strategies at once: reducing direct carbon emissions, choosing supply-chain partners who are also reducing carbon emissions (i.e., Scope 3 emissions reductions), and purchasing carbon credits.
The process of purchasing carbon credits is sometimes called “offsetting.” A company offsets its carbon emission “debt” by paying someone else to reduce carbon emissions. Both parties benefit from this: the credit purchaser pays to reduce their overall carbon footprint, and the credit seller gets material compensation for reducing emissions. Carbon markets were developed to facilitate this exchange.
Carbon Registries
A carbon registry is an independent third party that works with carbon credit buyers and sellers to ensure that the carbon credits represent real and measurable reductions in GHG emissions. Carbon registries have developed a set of standards for what constitutes an acceptable carbon credit. Each registry has slightly different standards and definitions, but generally speaking, all require that:
- Carbon credits be real and permanent
- Good accounting practices are used to avoid “double-counting” credits
- The process for measuring or calculating credits is regularly audited to ensure accuracy
Learn more about CIBO’s model validation report process
CIBO’s Mission: Enabling Agricultural Carbon Markets
Many processes produce greenhouse gases, and carbon credits can be generated in many ways. One of the best ways to remove carbon dioxide from the atmosphere is to sequester it in the soil. Farmers can generate carbon credits by reducing their greenhouse gas emissions and adopting practices that increase carbon sequestration on their land. Because farming and grazing lands are plentiful, these agricultural carbon credits are of growing interest in the carbon marketplace.
Several obstacles stand in the way of the farmer who wants to generate carbon credits. In addition to the cost of adopting new land management practices, such as cover cropping, reduced tillage, and reduced nitrogen fertilizer application, benefits to yield and operational profitability from improved soil health can take several years to realize. While the data is clear that such an investment is worthwhile in the long run, the necessity of making a large up-front investment can make these practice changes difficult for many farmers who are already operating on thin margins. Ideally, selling carbon credits would provide up-front funds for such improvements, but the credits are often not available until the farmer can prove that sequestration has taken place.
In addition, carbon sequestered in the soil is difficult to quantify. Direct measurement via soil sampling is inherently uncertain and so expensive that it can quickly consume the profits a farmer might make from selling the carbon credits.
At CIBO Technologies, our mission is scaling regenerative agriculture with reliable, trustworthy technology that delivers high-quality accounting for agricultural carbon. CIBO does this with CIBO Impact, our advanced software platform that helps enterprises scale their agricultural carbon programs to meet their carbon and climate commitments.
CIBO powers regenerative agriculture initiatives of grower-focused food and agriculture companies ready to meet their carbon and sustainability commitments. CIBO achieves our partners’ goals by leveraging our scaled software platform, CIBO Impact, to develop, deploy and manage sustainability programs that combine advanced science-based ecosystem modeling, AI-enhanced computer vision, MVR capabilities, and the most complete programs engine to connect growers, enterprises and ecosystems.
CIBO creates visibility into the carbon footprint of entire supply chains and supply sheds. We use ecosystem modeling to estimate carbon credits and minimize the need for soil sampling. To accomplish this, we need to demonstrate that our ecosystem modeling delivers consistent, accurate estimates of soil carbon flux.
The Model Validation Report (MVR) Process
Several registries are available for certifying agricultural carbon credits. CIBO chose to register a project first with Verra. CIBO’s was the first VM0042 project under validation in North America. Most of the major registries have very similar requirements for model validation, so we believe our experience is broadly applicable to other registries as well.
The registry protocol, VM0042 “METHODOLOGY FOR IMPROVED AGRICULTURAL LAND MANAGEMENT,” details how agricultural carbon credits are accounted for and assigned. This protocol specifies how models, such as CIBO’s SALUS model, can be used to estimate carbon flux. The accompanying model validation protocol, VMD0053 “MODEL CALIBRATION, VALIDATION, AND UNCERTAINTY GUIDANCE FOR THE METHODOLOGY FOR IMPROVED AGRICULTURAL LAND MANAGEMENT,” details how such an ecosystem model must be tested to demonstrate its accuracy and applicability.
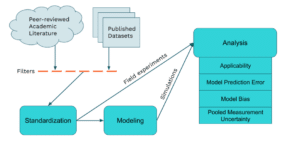
A large part of the process involves comparing modeled results to results found in published literature. That is, a researcher studies the effects of farming practice changes and publishes a set of observations related to soil carbon change. At CIBO, we create an in-silico experiment matching the real-world conditions of the study, and compare our modeled results with the published outcome. Although the process seems simple, in practice it proved to be a monumental effort, with many pitfalls.
Finding the Right Datasets
This first step in validating a model is to find appropriate “ground truth” data for comparison to model simulations. The model validation protocol VMD0053 specifies, “Measured datasets must be drawn from peer-reviewed and published experimental datasets with measurements of the emissions source(s) of interest (soil organic carbon (SOC) stock change and/or N2O and CH4 change, as applicable), ideally using control plots to test the practice category.” At present, every organization that wants to use modeling as part of the agricultural carbon process must independently search for and identify the appropriate published datasets.
To ensure that no potentially useful datasets were ignored, CIBO started by casting a wide net: we developed a set of search terms to capture potentially relevant papers, then reviewed each paper for actual relevance. Datasets that are not agricultural in nature, experiments that are located in other parts of the world, or datasets that rely on crops and/or practices that CIBO is not modeling for the Verra project were excluded.
In all, CIBO had a team of 12 scientists running searches and filtering publications. The initial searches identified hundreds of possible papers, which were eventually narrowed down to approximately 60 relevant publications. Some of these were later discovered to have technical problems (such as omissions of key variables) that rendered them unusable. Others were found to be duplicates of datasets already ingested. In the end, CIBO curated 39 datasets from peer-reviewed, published sources, with a total of 298 treatment comparisons. This is one of the most comprehensive collections, to date, of agricultural emissions and carbon flux data for the crops and practices covered in the CIBO Verra program.
Extracting and Curating Data
Generally speaking, each dataset consists of two parts relevant to the model validation process: the measured soil organic carbon (SOC) values and the accompanying information about what locations and agricultural management practices were used in the experiment. The measured SOC data are needed to calculate the “ground truth” carbon credits resulting from practice changes that occurred in the field experiments. The location and management information about a field experiment are needed to create a simulated experiment that mimics the real world conditions of the plant. Such a simulated experiment represents instructions for the SALUS model about the real-world experiment. Executing the computer experiment produces simulation results from which simulated carbon credits can be calculated and compared to the measured carbon credits.
Extracting the two types of data from the literature is a complicated and manual process that often requires expert knowledge, because the data come in various formats that have to be harmonized prior to utilization. Agricultural management practices, in particular, are generally presented in narrative form, and may not include enough information to create the simulated experiment necessary to run the crop model. In these cases, CIBO uses proprietary crop management models to infer management practices like cultivar characteristics, planting date, etc. that vary across production systems in the United States.
In addition to management practices, soil and weather data about the locations of the field experiments are needed to create the computer experiment for running the SALUS model. These data are obtained through CIBO’s soil and weather services which require the geographic coordinates of the field experiment locations to be known. These geographic coordinates were extracted from the curated data and datasets with no geographic coordinates were not used.

Share the Confidence in Carbon Modeling Paper
Calculating Carbon Credits
For the purposes of this project, a carbon credit is simply the annual soil carbon gain/loss between a baseline practice or control treatment (e.g., continuous corn with no cover crop) and a regenerative practice (e.g., adding a cover crop to a corn-corn rotation), expressed as metric tonnes of CO2-equivalents gained or lost per acre per year. The measured carbon credits were calculated directly from the raw SOC data extracted through the data curation process.
The modeled carbon credits were calculated from the model outputs obtained by executing the computer experiments for both the baseline and regenerative practices for the same number of years the field experiments were conducted. The results presented in the next sections assess the ability of the SALUS model in simulating the measured carbon credits based on information about the field experiments supplied to the model as inputs, and given uncertainties in the measurements quantified by the Pooled Measurement Uncertainty (PMU, see next section for more detail).
CIBO’s Results
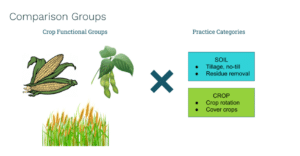
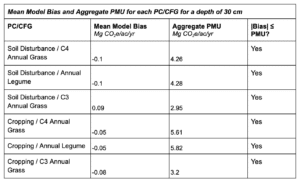
Across all curated data, CIBO found 298 relevant measurements for comparing simulated and observed results. These results are grouped by practice category (soil disturbance or cropping) and crop functional group (C3 annual grass, C4 annual grass, or annual legume). For each combination of practice category and crop functional group, we calculate the pooled measurement error, the model bias, and the model error standard deviation. Then we compare our own model bias to the pooled measurement error found in the datasets.
Pooled Measurement Uncertainty
Pooled measurement uncertainty (PMU) is meant to represent the uncertainty associated with experimental measurements of SOC. PMU is defined as the weighted average of standard errors of all the measured values for a given practice change. PMU should, ideally, be derived from observed variation between replicated measurements within an experiment. However, most studies do not provide data from replicates that could be used to estimate measurement uncertainty. Where replicates for a study are provided, they typically consist of several measurements across experimental blocks and/or within individual treatment plots, which capture the combined uncertainty stemming from both measurement error and sampling uncertainty (e.g., due to spatial variability). Although there is likely to be spatial variability within an individual treatment plot, the assessment of PMU for this Model Validation Report considered measurements collected within the same plot at the same depth and time as replicates and averaged those measurements for this analysis.
Estimating unreported measurement uncertainties were especially challenging. Although VMD0053 does not provide explicit guidelines for these cases, it allows for an alternative computation method for PMU as a whole: rather than computing PMU for each practice change, PMU may be computed using all studies in the validation dataset using the same measurement technique (e.g., dry combustion, loss on ignition, or older chemical approaches for soil organic carbon determination) regardless of the crop functional group studied. This is not an ideal way to calculate a SOC stock uncertainty, however, as it does not account for the uncertainties associated with bulk density measurements or account for the size of the soil depth interval measured. CIBO took a hybrid approach for missing observed uncertainty, by calculating a PMU for every reported SOC concentration and bulk density measurement method, then propagating these uncertainties through the calculation of SOC stock for each unreported measurement uncertainty according to its measurement method. These were then combined with the observed measurement uncertainties to calculate PMU by cumulative depth for each practice change and crop functional group combination.
CIBO’s approach to calculating PMU is explicitly designed to calculate PMU for the entire soil profile sampled. There is wide variation in the depth increments and total depths to which the studies comprising the validation dataset sampled. Converting to a cumulative depth for each given observation depth allows CIBO to combine studies together to calculate a more accurate PMU. For example, a small number of observations were taken from 23-30 cm. Using the cumulative depth approach, the observations from 23-30 cm could build on the uncertainty derived from any soil samples shallower than 23 cm, and be combined with uncertainty derived from observations of 0-30 cm and 15-30 cm depths. By using this cumulative depth approach, CIBO is able to take a more holistic view of sampling uncertainty that is less sensitive to individual studies with particularly high or particularly low sample variability.
Finally, each calculation of net impact to SOC stocks due to a practice change requires at least four estimates of SOC content and four estimates of bulk density: initial and final measurements for both treatments at every depth sampled in the study. Many studies neglected to measure SOC at the beginning of the study. These studies assume, implicitly or explicitly, that the initial conditions of the differing treatments are the same. CIBO treats a missing measurement as if it had the same uncertainty as available measurements for a given study. This is a conservative choice, as it underestimates measurement uncertainty, decreasing PMU associated with the studies, and requiring a similarly smaller model bias to pass validation.

Share the Knowledge of CIBO's Model Validation Process
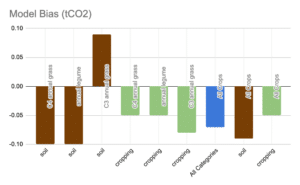
Model Bias
Model bias assesses the tendency of a model to systematically under- or over-predict a change in SOC. If there is a significant model bias, this fact must be used to adjust the calculated carbon credits. In order to assess the significance of the model bias, it is compared to the Pooled Measurement Uncertainty of the published datasets. In order to have a project approved by Verra as a high-confidence agricultural carbon credit program, the absolute value of a model bias must be less than the PMU of the published data sets. This ensures that the model is not effectively unbiased.
In our case, the model bias over all categories was -0.07 Tonnes/acre/year. This means that our model underestimates carbon credits by 0.07 credits on average given the sample of studies used.
Model Error Standard Deviation
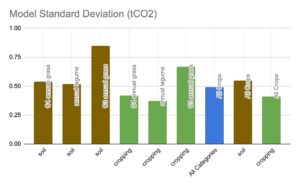
As explored above, every modeling system has a statistical bias. That bias can be large or small or, in an ideal world, zero. It is useful to calculate the standard deviation of the error of any carbon model against experimentally observed soil carbon values. This is known as the Model Error Standard Deviation (MESD). The model error standard deviation captures the error or uncertainty of the model in estimating changes in SOC. Armed with this information, we can compare the accuracy, efficacy, and reliability of a carbon model to experimentally observed soil carbon calculations.
Model error standard deviation is meant to capture the error or uncertainty of the model in estimating change in SOC. In the case of our validation reporting, model error standard deviation is the typical (i.e., average) distance between individual model errors (corresponding to the 298 data points that passed our review). MESD quantifies the magnitude of error in SOC estimation, and can be thought of as a measure of overall process reliability.
Our overall model standard deviation is 0.49 carbon credits. This can be thought of as the average estimation error on an individual field. This number is used to quantify the uncertainty of the carbon project as a whole, and ensure that the project does not issue more carbon credits than are actually generated.

What We Learned
Manual Soil Carbon Measurements are Noisy
While manual soil sampling, bulk-density measurement, and laboratory based carbon-quantification techniques are considered the reliable and traditional method of baselining carbon footprint and ground-truthing SOC, our calculations on PMU on the public data set show that the assumed reliability of these processes may be misplaced. To be sure, at one time these were the state of the art. However, the art has progressed substantially with advances in SOC quantification in data modeling and simulation. Manual measurement of soil carbon produces noisy results with higher, sometimes substantially higher, Pooled Measurement Uncertainty, when compared to the uncertainty of a model such as CIBO’s.
Appropriate Datasets are Hard to Find
At CIBO, we defined search terms and examined hundreds of journal articles to locate every dataset that could be relevant to our project. Many good datasets had to be discarded because they did not include control treatments (i.e., treatments in which baseline or non-regenerative practices were used), or control treatments were located in fields with different soil properties and weather than the experimental treatments. In such cases, an unbiased comparison of practice changes and a correct estimation of carbon credits were not possible. Other datasets showed no significant change in carbon, and thus could not be used. Our study did not consider the efficacy of various farming practices on sequestration of CO2e in soil, only the bias and uncertainty of the process of measuring when a change in soil carbon was detected. In the end, we narrowed our search to 39 publications, containing a total of 298 relevant treatment comparisons. For MVR purposes, those treatment comparisons must be subsetted by crop functional group and practice category. In some cases, the number of comparisons in a specific category was quite small. For example, cropping practices in C3 annual grains yielded only 13 relevant comparisons in the published data.
It should be noted that the crop groups (C3 annual grasses, C4 annual grasses, annual legumes) and the project area (midwestern grain belt) are certainly the most widely-studied in the US, and perhaps in the world. The numbers cited here, therefore, are almost a “best-case scenario” for the amount of suitable data likely available to any agricultural project. (A few publications were excluded because they contained practices outside of the scope of our Verra project.)
Of course, new publications come out every day, and additional relevant studies will be published. But the most helpful datasets are long-term studies, so there is unlikely to be an influx of new datasets in the near future.
Data Ingestion Requires Great Care
Running computer simulations based on published results requires some interpretation of the experimental conditions. The scientists who performed the original research could not anticipate how their results would be used, and could not know what ancillary information would be most helpful. In order to create a simulation that is faithful to the original experiment, some subject-matter knowledge is required, as well as the ability to “read between the lines” of the research report, “other cultural practices were similar to those used by local producers” and similar phrases often replace detailed reporting of management practices in the published literature.
In some cases, multiple publications were created from the same underlying dataset. In such cases, a comparison of the publications revealed that no one paper contained all the relevant details; by combining details across papers, a fuller picture could be obtained of how the research was carried out.
The SALUS model is driven in part by environmental forcings: weather records and soil types determined using the geographic location of a given field. We found considerable variation from one publication to another in how (and how precisely) field locations were specified. In many older studies, field locations are reported to the nearest minute of latitude and longitude, an area covering approximately 1 square mile. Although this is likely sufficient spatial precision for the historical weather records used in the SALUS model, the model runs on a representative soil polygon within a field. Each field may have multiple soil polygons, and the texture of soils can vary significantly over a short spatial scale. In cases where experiment locations were imprecise or soils were described generically (e.g., “silt loam”), we had to infer a specific soil (e.g., “The Winfield Silt Loam”) and an agricultural location within that soil series.
Data Interpretation is Both an Art and Science
Because there is no single accepted lexicon for experiments of this type, some interpretation is also necessary to “map” the terms used in a publication to the parameters needed for computer simulation. This mapping requires considerable subject-matter expertise, and a willingness to share and discuss interpretations with other team members. It’s important that these activities be tightly coordinated and ideally restricted to a small group of trained data scientists, as style and nomenclature differences can introduce bugs into the data ingestion pipeline.
It should be noted that this type of interpretation is at least somewhat subjective. Through a process of inquiry and discussion, our team was able to agree on interpretations that seemed reasonable to everyone. However, a different team, with different field experiences might very well make different reasonable interpretations.
These details of mapping and interpretation have effects on the modeled output that can be difficult to quantify. We anticipate that in the future, efforts will be made to compare one modeling system to another. Such comparisons will be more meaningful if a single set of interpretations can be an agreed-upon standard. Similarly, a common experimental dataset to use as a comparison baseline is an ideal to be sought when comparing different models. Even so, different models require different inputs, and thus different mappings of experimental conditions, so direct model-to-model comparisons will always be challenging.

Standardized Analysis is Important
Good data engineering is needed to support the MVR process. Reproducible results, efficiently produced, do not happen by accident; they result from a planned and engineered pipeline. What follows is a partial list of items to consider when setting up such a pipeline.
Quality of Input Data
Quality of Input Data
As noted elsewhere, we found many published datasets where no significant results were reported. These datasets are not useful for MVR purposes and must be excluded from the final analysis. If a dataset comes from a published paper, the significance (or lack of significance) of the results will usually be reported. If there is no published paper, it’s necessary to analyze the data for significant results before including it in the MVR pipeline. We observed that datasets without an accompanying paper often had no significant results.
Automated Data Ingestion
Automated Data Ingestion
Whenever possible, data ingestion should be accomplished through a coordinated code base. Research stations, such as Kellogg Biological Station (KBS) publish many large sets of data in standardized formats, and it’s more efficient to maintain a code base for ingesting such datasets.
Quality Control of Input Data
Quality Control of Input Data
Data from publications are sometimes available for download in an easily-ingested format, but often not. It’s a good idea to set up a formal QA/QC process for manually and semi-manually tabulated data. Each dataset is unique, so the opportunity for error is multiplied.
Automated Analysis Pipeline
Automated Analysis Pipeline
Once data is ingested, it’s a good idea to maintain a single code base for data analysis. It’s worth noting that different analysis sections (PMU, bias, variance) will re-use many of the same calculations, so having a single code base for the calculations will reduce bugs and avoid duplication of effort.
Conclusion
SOC and carbon credit modeling is the new state of the art. This approach is required to deliver results at scale and in a non-cost-prohibitive way. However, proving confidence in modeled results, over and above experimentally determined results, is a vital step to engender trust in carbon credits and close the loop on incentivizing and funding carbon sequestering and carbon credit creating farming practices. The market will not invest in carbon credits that are suspect or in practices and programs that are anything less than fully transparent and pristine.
CIBO Technologies is leading the way and blazing the trail so that others may follow and prove how their systems, programs, and models deliver as-good or better-than results compared to traditional soil sampling. CIBO remains committed to the community of concerned scientists, citizens, and companies that are focused on innovation and solution engineering in this problem domain. We invite companies, academics, concerned citizens, and journalists to engage with us to lean in and learn more about our process, the publications we used, and the approaches we took. Our hope is that our work makes it easier for others to go even further as we help tackle some of the biggest challenges of our age.
Download the eBook:
The Definitive Guide To Regenerative Agriculture
Download the eBook:
The Definitive Guide to Low Carbon Corn for Carbon Neutral Ethanol
Download the eBook:
Getting Started on Your Scope 3 Journey in Agriculture
Download the eBook:
Confidence in Carbon Modeling
Download the eBook:
The Current State of Net-Zero Target Setting and Accounting in Agriculture
Download the eBook:
Boots on the Ground: Accelerating Regenerative Agriculture Program adoption with CIBO’s Tech-Enabled Grower Network Partners
