Deliver High Impact Regenerative Agriculture Programs with CIBO
The industry’s first fully integrated solution for program design and deployment, grower qualification and enrollment, emissions and soil carbon quantification, satellite-based verification and convenient reporting.

THE Latest
CIBO Technologies Empowers Ag Partners and Farmers to Access $1.5 Billion RCPP Funding
How on Earth can we better unlock the full potential of climate smart ag? Reduce the risk for farmers.
Transforming Agriculture: USDA’s $1.5 Billion Boost in RCPP Funding Creates New Opportunities for the Private Sector and Farmers
Going Beyond Traditional Life Cycle Assessments: Four Ways CIBO Impact Enriches LCA Data
CIBO Technologies Recognized by TIME as one of America’s Top GreenTech Companies of 2024
CIBO Technologies Panel Discussion at World Agri-Tech Innovation Summit: Stacking Public and Private Incentives for Accelerating the Transition to Sustainable Agriculture
Learn the Importance of Stacking Public and Private Incentives with CIBO and Ag Industry Leaders at the World Agri-Tech Conference
CIBO Technologies Enabling Carbon Intensity Modeling at Scale Using GREET
Create Farm-Focused Sustainability Programs With Confidence
CIBO is on a mission to accelerate regenerative agriculture. We bring together science, technology, and the most advanced programs engine to enable and scale your programs. From Scope 3 reporting to Verra-verified carbon credits to grower incentive programs, CIBO Impact provides a comprehensive grower-friendly platform to support your initiatives.
Power Regenerative Agriculture Programs
CIBO supports the goals of our partners by leveraging our scaled software platform to develop, deploy and manage sustainability programs.
Explore The Software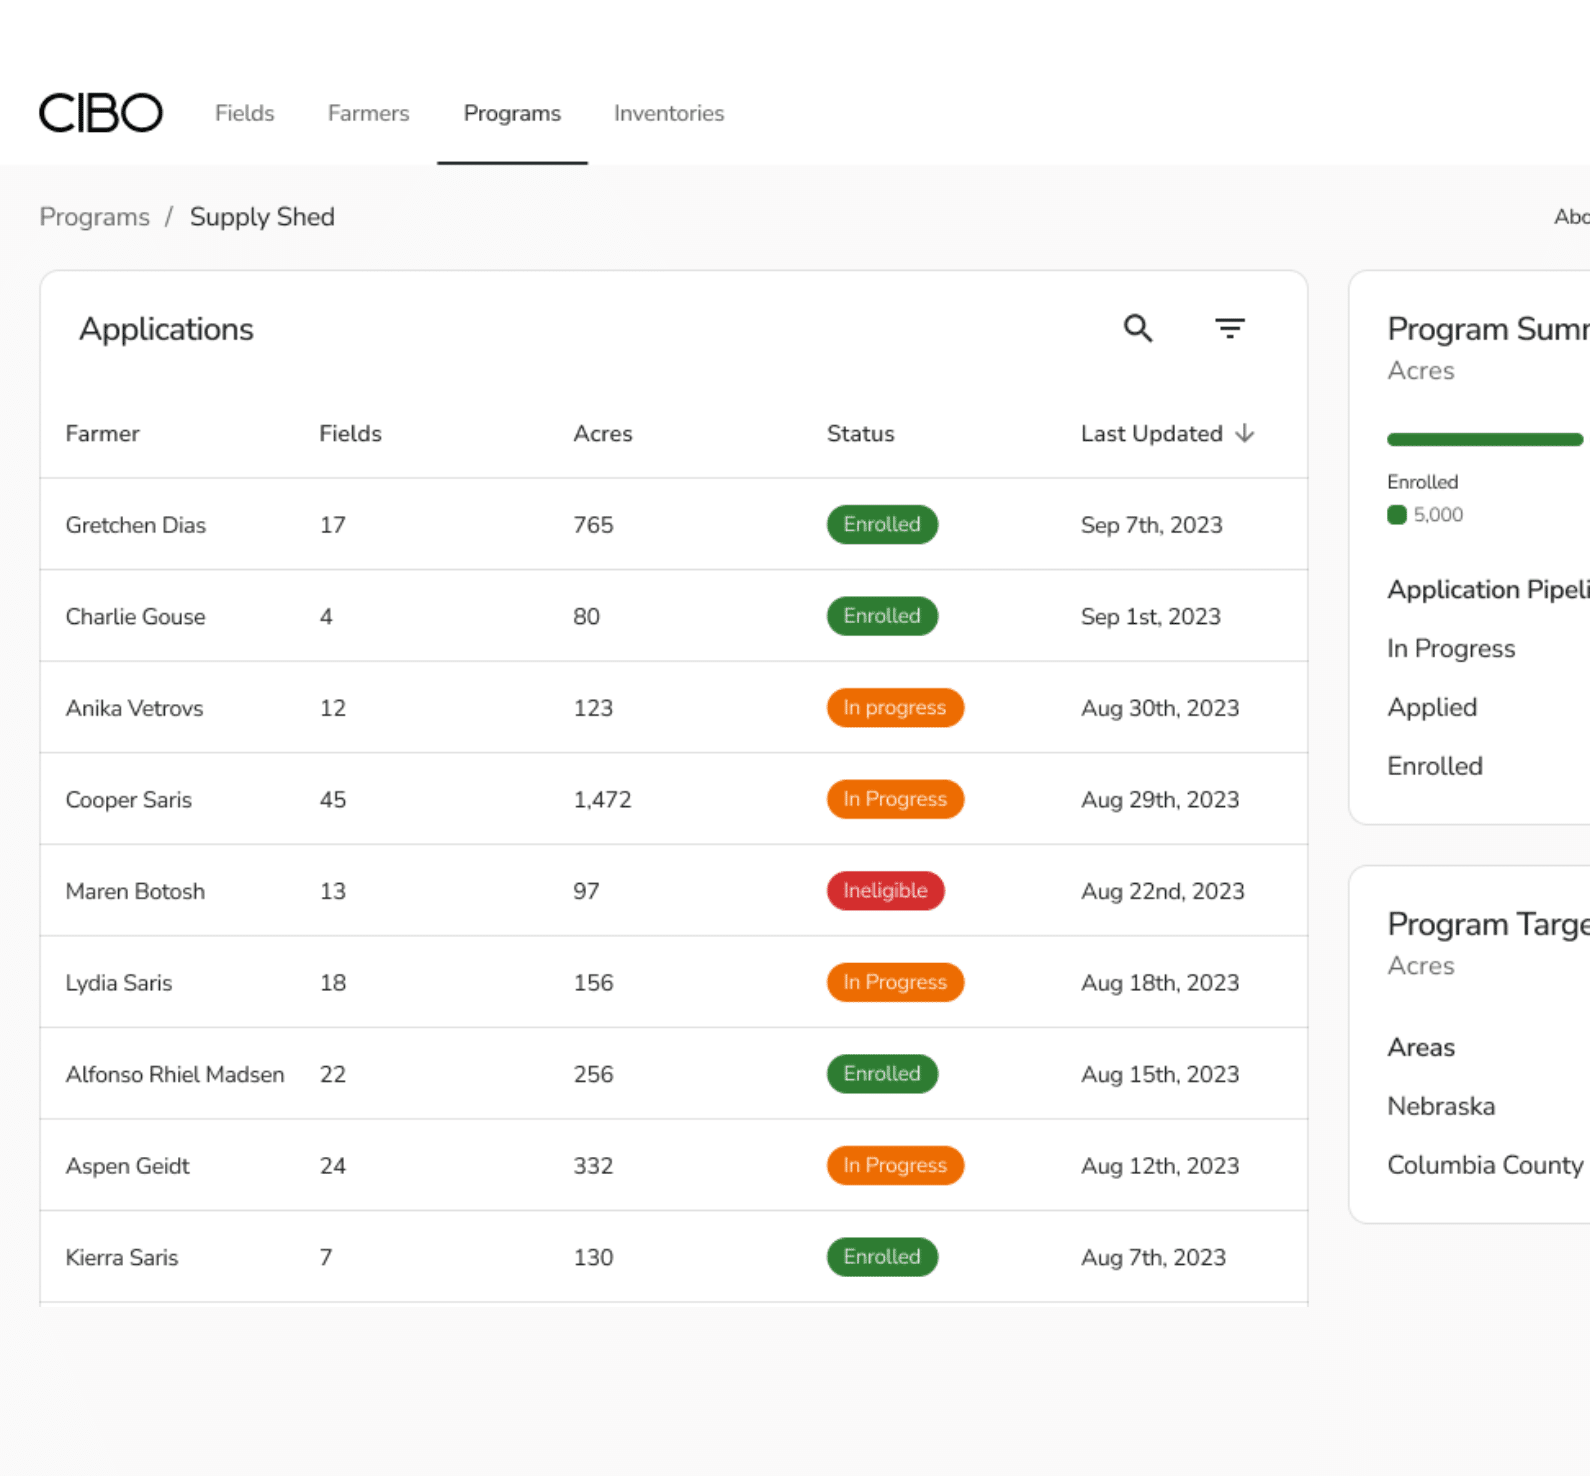
Rapidly Deliver Grower Incentive Programs
The CIBO Programs Engine provides rapid program matching, pre-qualification, opportunity sizing and enrollment through a convenient user experience that makes it easy for growers to participate in programs and convenient for enterprises to find, engage and pay growers.
Explore the Programs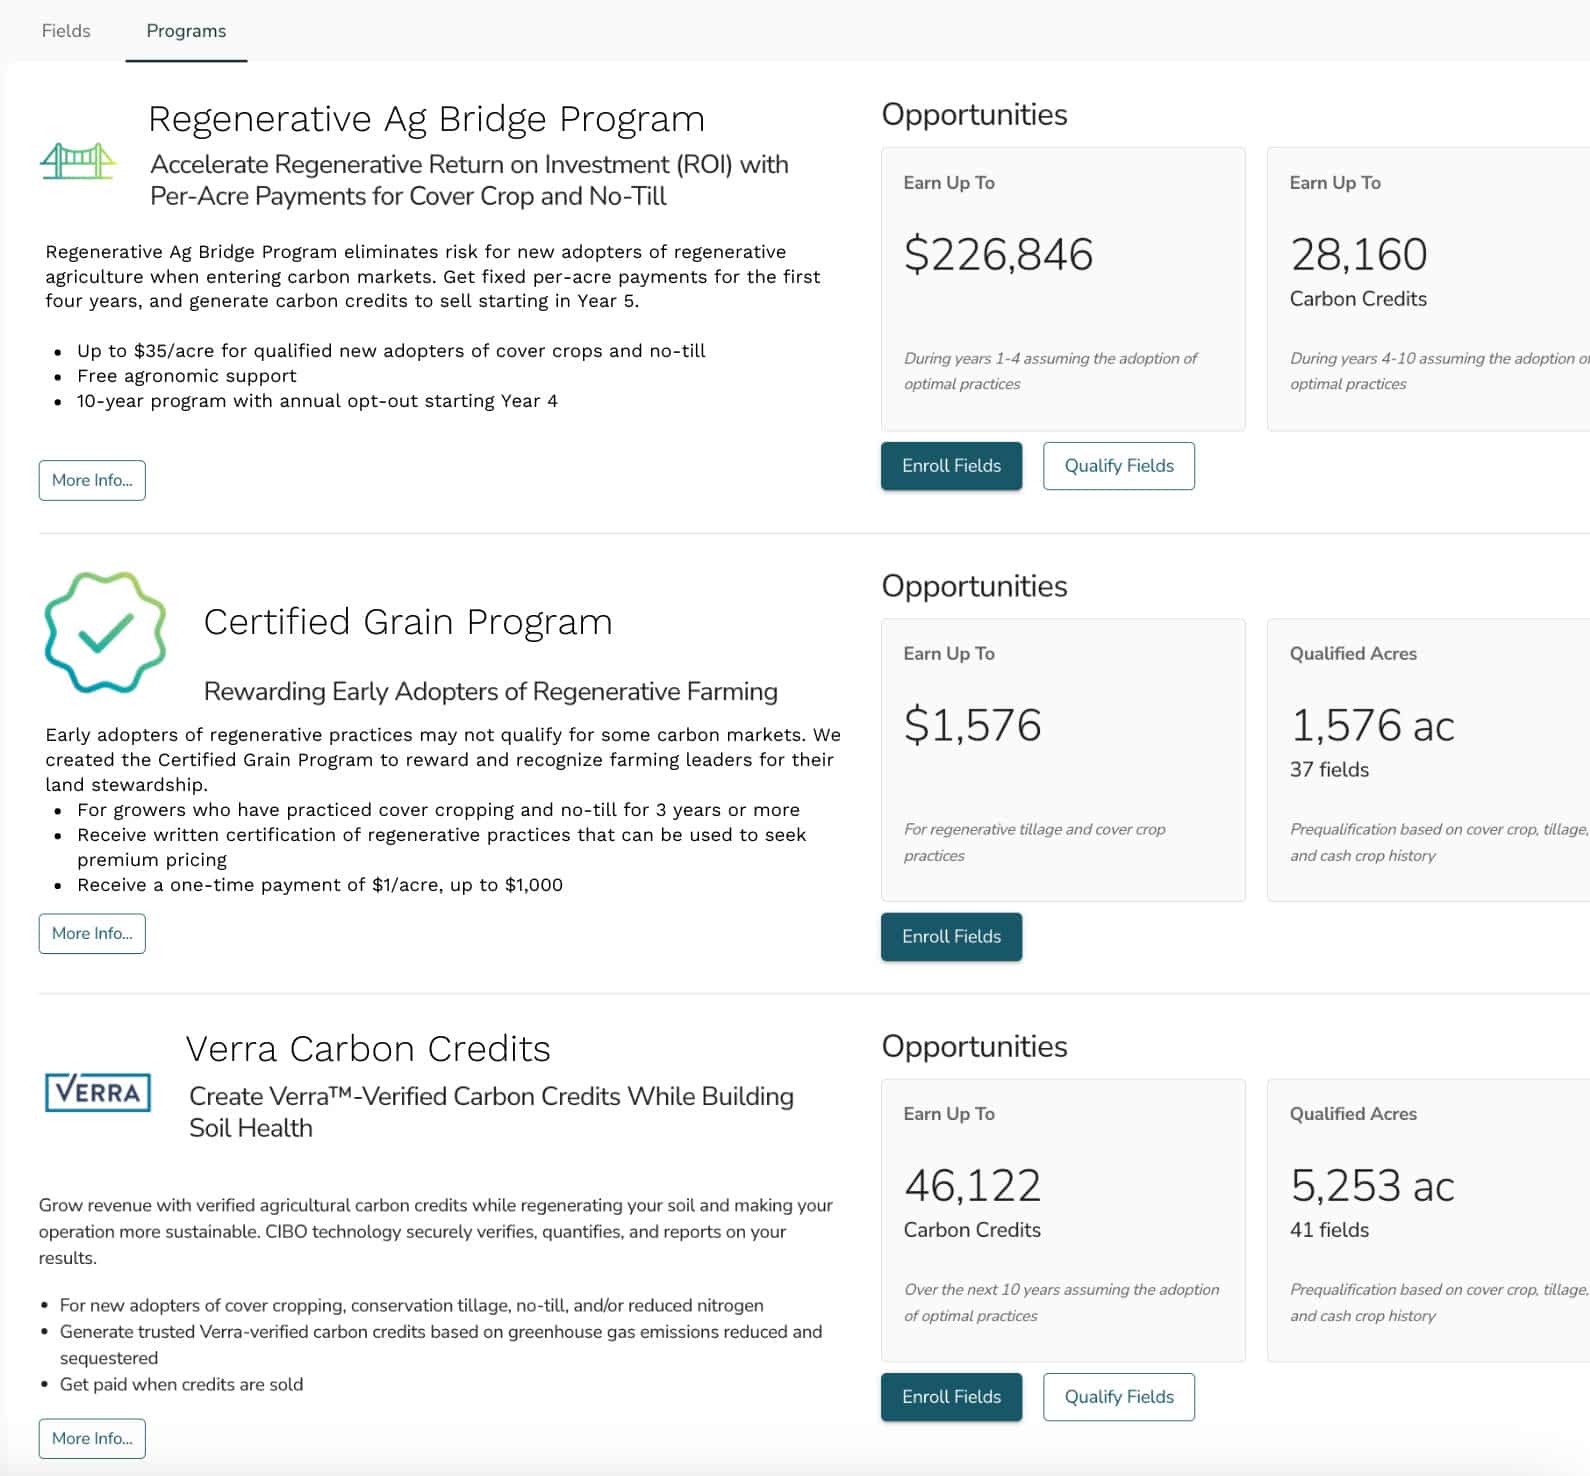
Verify Practices Without Stepping Foot on the Ground
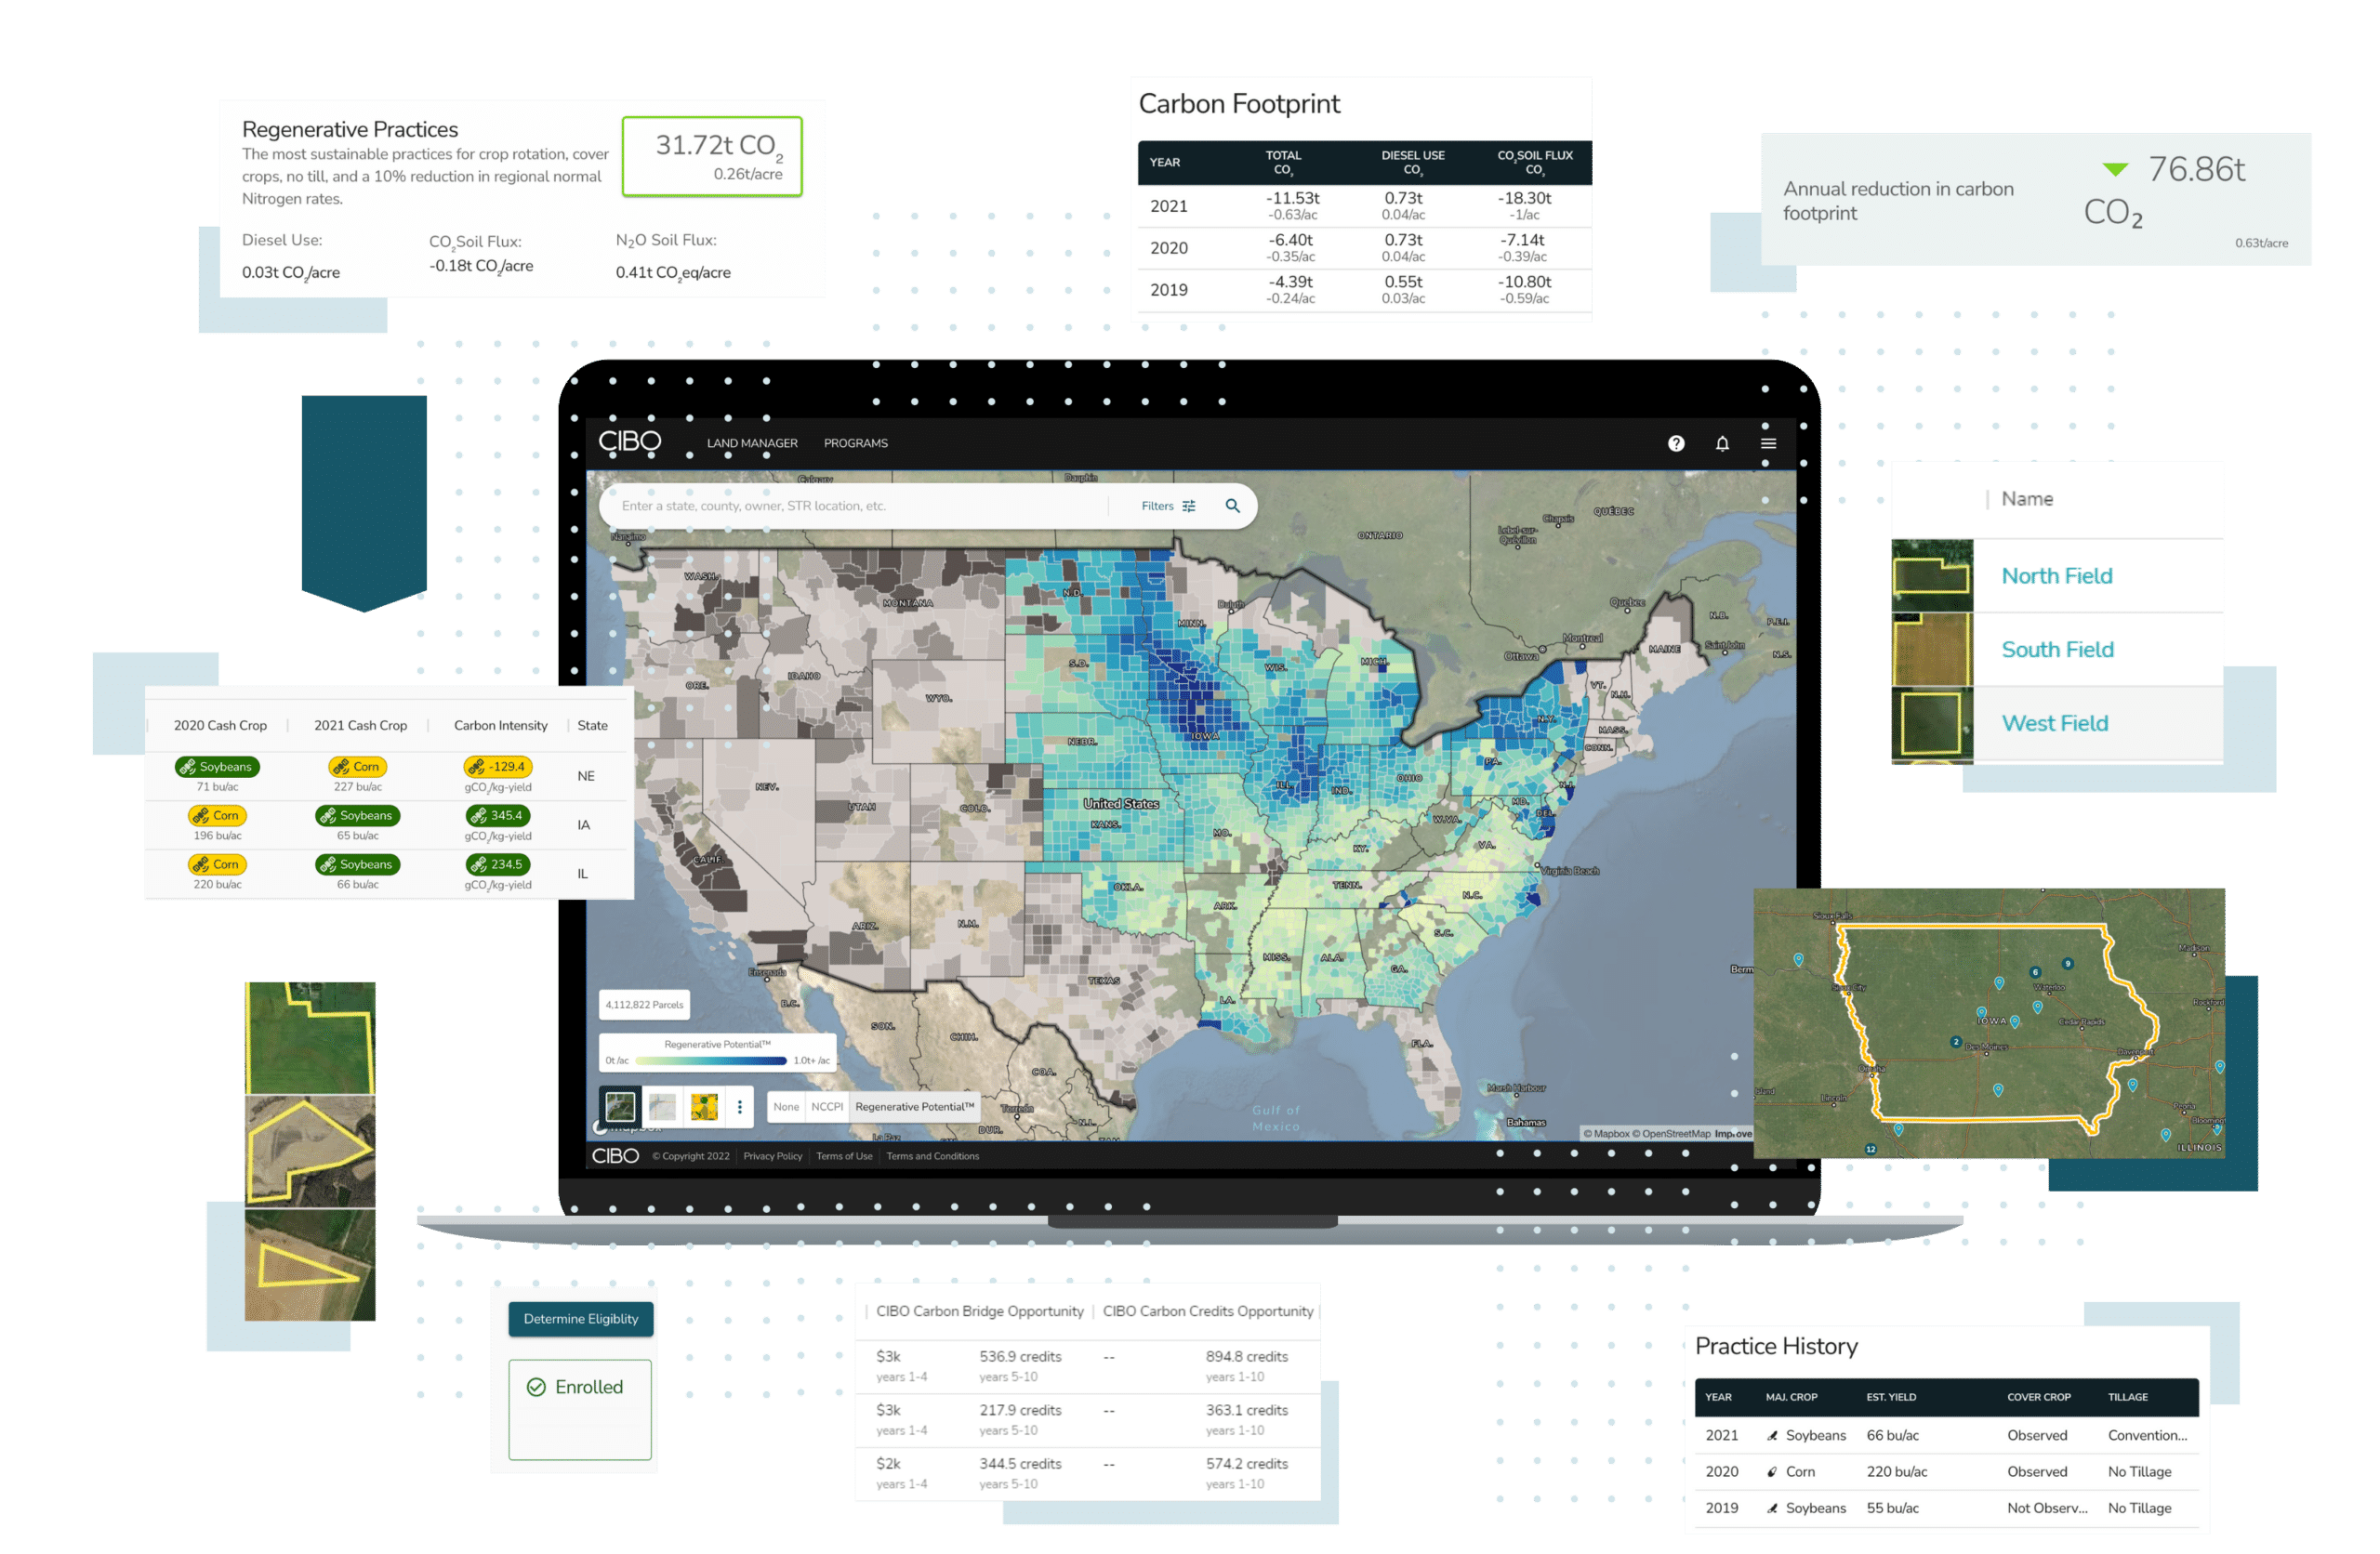
CIBO’s remote vision technology and AI-driven inference engine determine practice history, including tillage and cover cropping, and verify newly adopted practices in compliance with program requirements. Report on key data and program results, such as acres enrolled and emissions reductions.
See Further with CIBO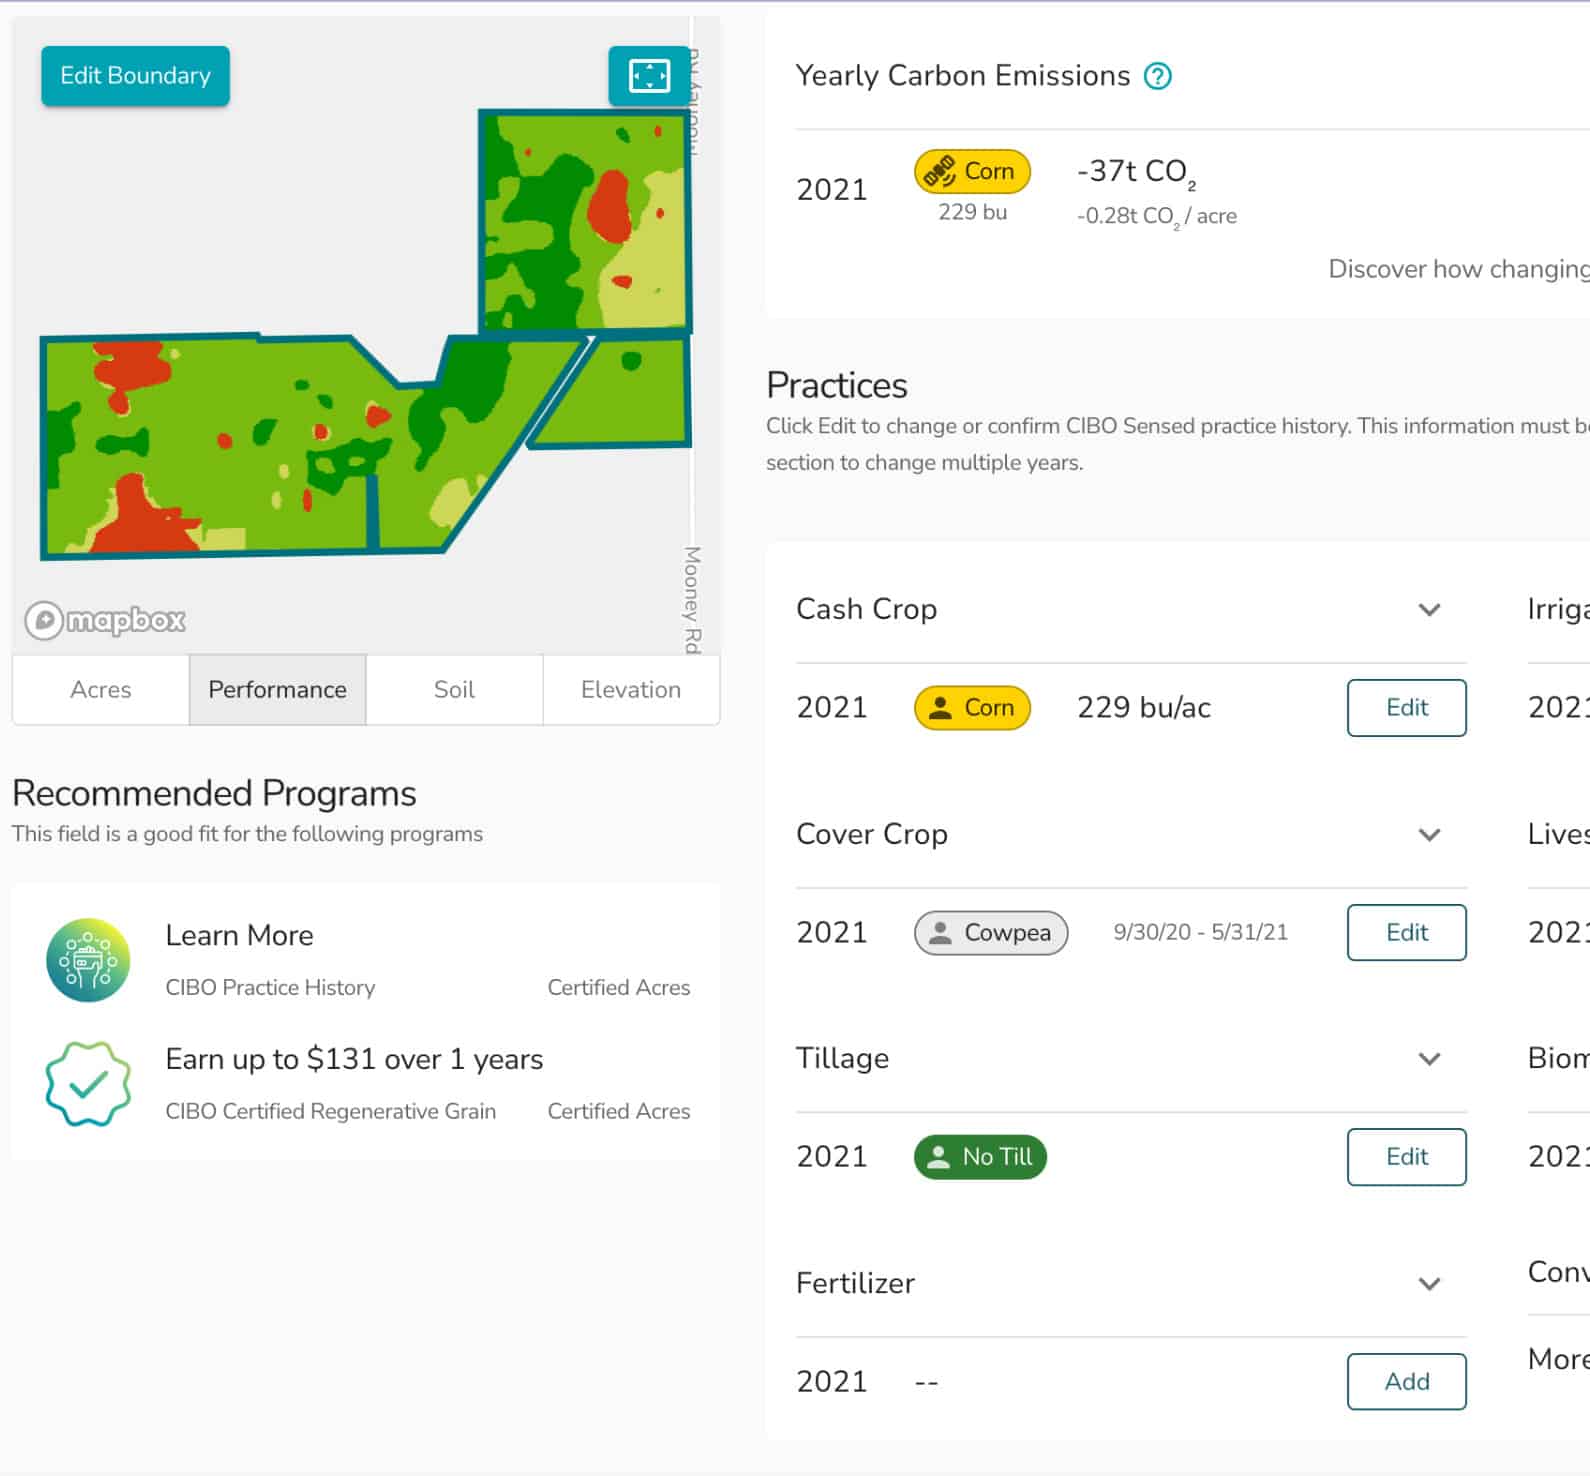
Understand Practices and their Impact at Scale
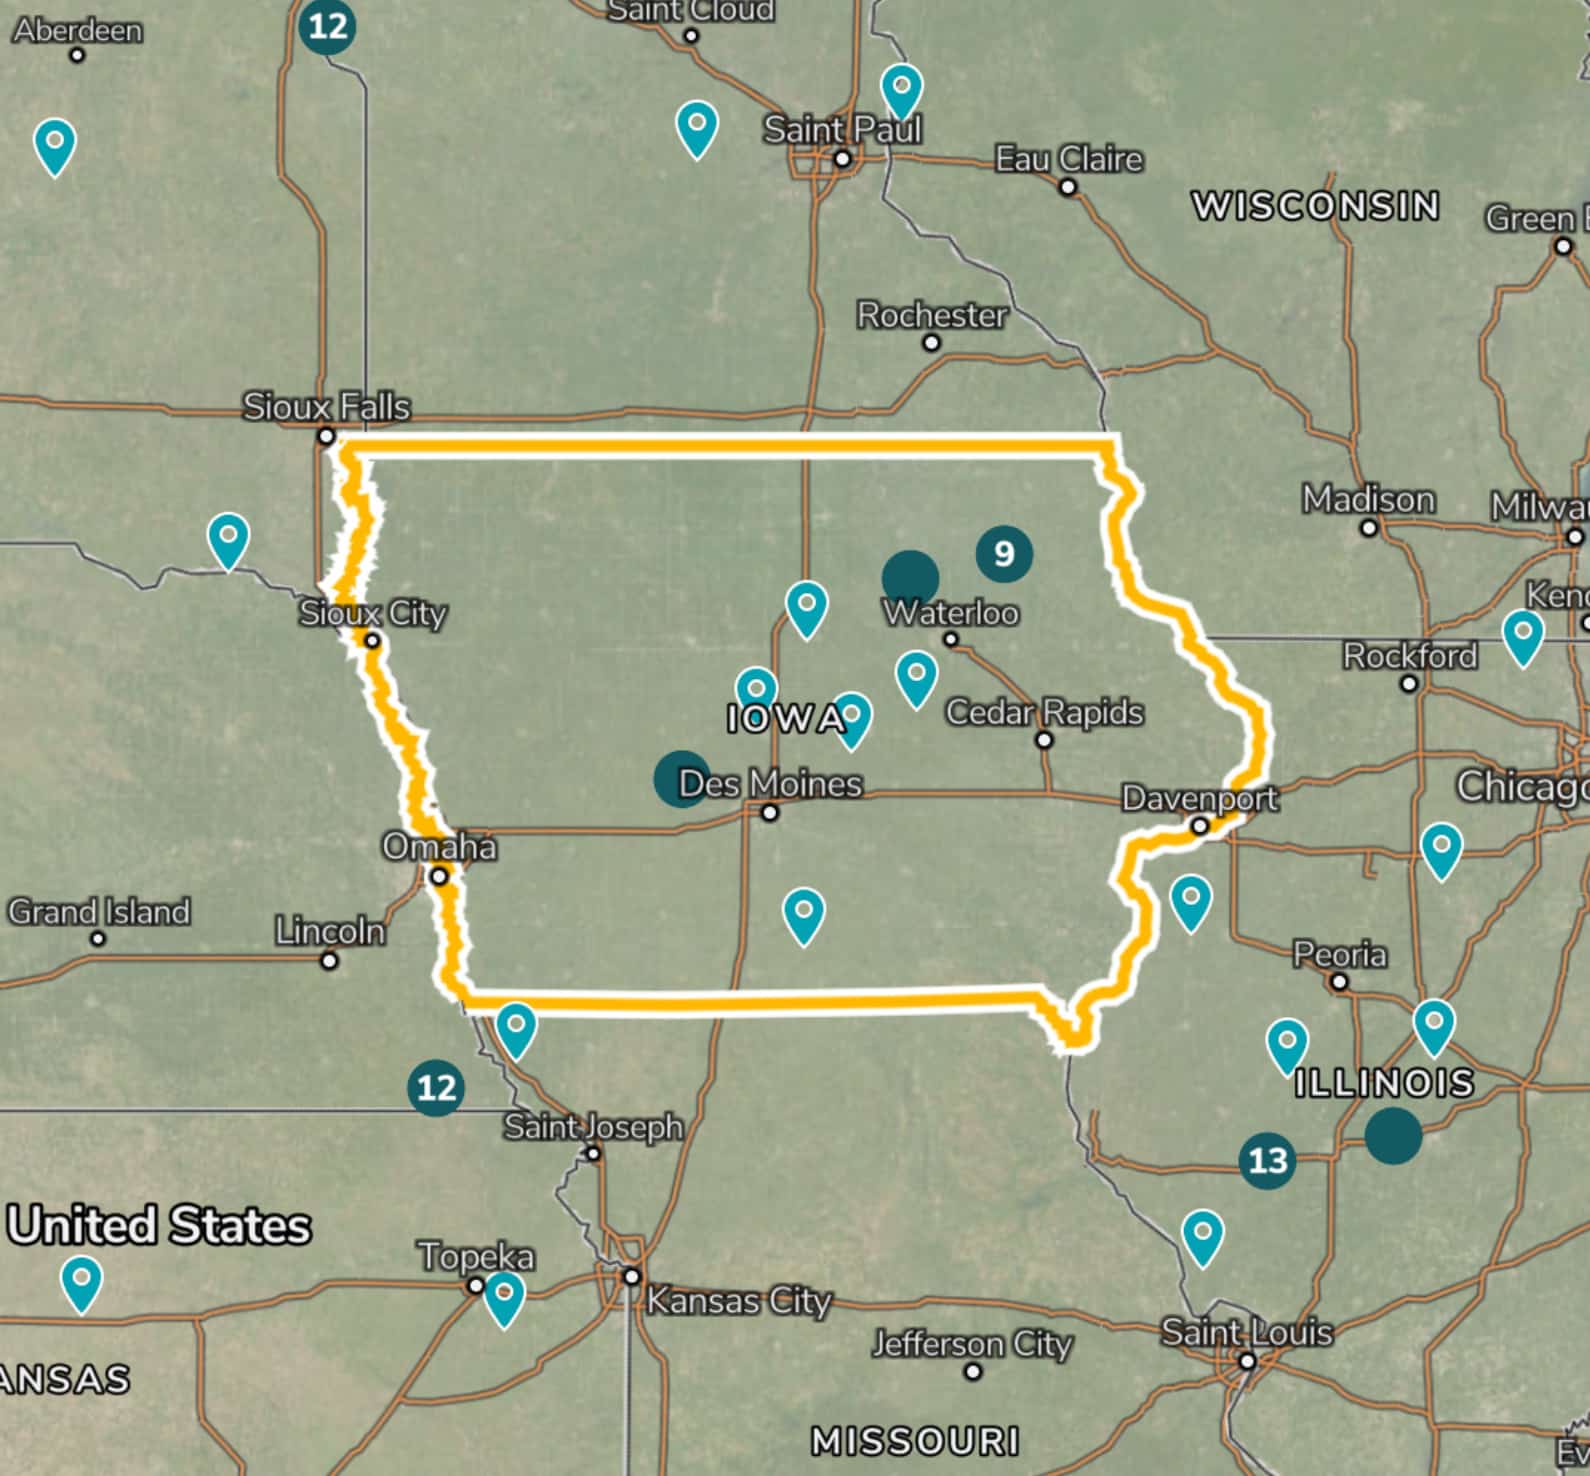
Supply shed-level analysis capabilities support annual greenhouse gas inventories, target setting, reduction efforts and voluntary reporting requirements. Display total emissions, carbon intensity and practice adoption rates across standardized and user-defined supply sheds. View cash crop, cover crop, tillage, total emissions, carbon intensity and regenerative potential. Perform what-if analysis on the impact of new practice adoption to see how incentive programs can help achieve carbon reduction and regenerative adoption targets.
Build a Sustainable Future