Visualizing Carbon Intensity in CIBO Impact
Watch the recorded webinar to hear from CIBO’s Director of Agricultural Carbon Grant Ivison-Lane and Director of Product Management Adam Pasch about the importance of understanding the carbon intensity of crops. In this talk, they’ll break down what carbon intensity is and the role it can play in reducing scope 3 emissions across supply sheds.
Key Questions Answered in the Webinar include:
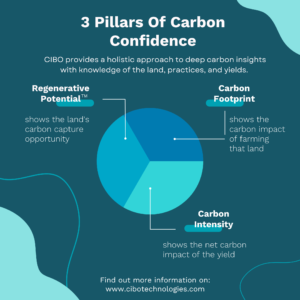
What are the key parts and components of carbon confidence?

Regenerative Potential:
- Metric tonnes of carbon that could be sequestered and avoided under ideal regenerative practices.
- This is how sustainable farming impacts and improves the land.
Carbon Footprint:
- The total CO2e and GHGe emissions created in a year from farming the land.
- Varies by location and by farming practices.
Carbon Intensity:
- Grams of CO2e by unit of yield.
- CIBO quantifies CI by g per KG of yield for each year.
Why is carbon intensity important for agriculture and companies with agriculture in their supply chains? Why are companies talking about it?
The big reason is companies have targets to reduce emissions from agreements we’ve set at a global level. If we want to reduce global warming, companies want to be part of that solution and reducing emissions from agriculture needs to be part of that solution. When we look at the annual footprint of producing something like an agricultural commodity – ex. corn or soy – we need intensity metrics to communicate that. It needs to be part of the annual inventory process and it’s also part of setting intensity goals and targets.
Then there are a lot of changes in intensity depending on the year because agriculture exists in a living environment. It’s also different per crop. Farming practices could produce more carbon to produce a kilogram of soybeans versus corn. The CIBO platform helps you distinguish by year, crop and practice to help you understand the carbon emissions that were emitted to produce that piece of crop both historically and in the future. What is the carbon cost to produce a particular crop in a specific year in a specific location.
Watch the webinar to learn more!
Watch the Webinar
About Grant Ivison-Lane
Grant Ivison-Lane is the Director of Agricultural Carbon at CIBO. Grant is multidisciplinary with a background in ecosystem services assessment and greenhouse gas (GHG) accounting. Grant has seven years of experience supporting GHG inventories for large agricultural companies, market programs that generate Scope 3 GHG credits, standards advocacy, and CDP reporting in compliance with the GHG-Protocol Corporate and Scope 3 Standards. Grant developed some of the first agricultural inventories of GHG emissions in California’s San Joaquin Valley and also has applied ecosystem services frameworks to support decision-making on large, multi-stakeholder projects. Grant is passionate about ensuring the full breadth of societal benefits generated by agriculture are valued when we consider all that working lands can provide.
About Adam Pasch
Adam Pasch is the Director of Product Management at CIBO, a science-driven software startup. Dr. Pasch is a Certified Consulting Meteorologist by the American Meteorological Society as an expert in the application of weather information. He is an experienced Environmental Scientist with a demonstrated history of working in the scientific-software and applied research industries. Prior to CIBO, he worked for The Climate Corporation focusing on Weather Data Strategy and Operations and at Sonoma Technology, Inc as a Meteorologist and Project Manager. He holds a Ph.D., M.S., B.S. from Saint Louis University in Meteorology.


