By Laura Tramontozzi
At CIBO, we help you discover rich information about land quickly and easily. When exploring a map on a macro scale or in unfamiliar areas, it can be difficult to digest a large amount of information, compare stats, and understand geospatial trends. To help you more easily access land information at scale, we’ve added interactive map layers — a quick and easy way to visualize land insights.
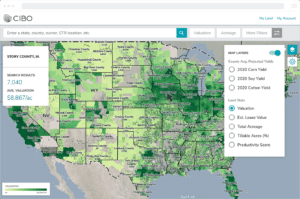
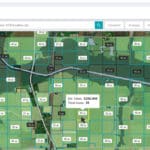
Interactive map layers present geospatial data, on the county, township and parcel levels, as easy to digest heat maps. These visualizations are clear and intuitive, allowing you to quickly see the distribution of data you care about most in any given area of the map — whether you’re exploring trends across state lines or comparing one parcel to another in your own backyard.
- Find your focus: Pan around the map and easily choose your area of interest.
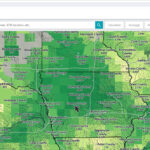
- Refine your search results: Layer meaningful data on top of your searches to gain a deeper understanding of the land.
- Compare land at-a-glance: Intuitively compare one area to another, at any zoom level, at-a-glance.
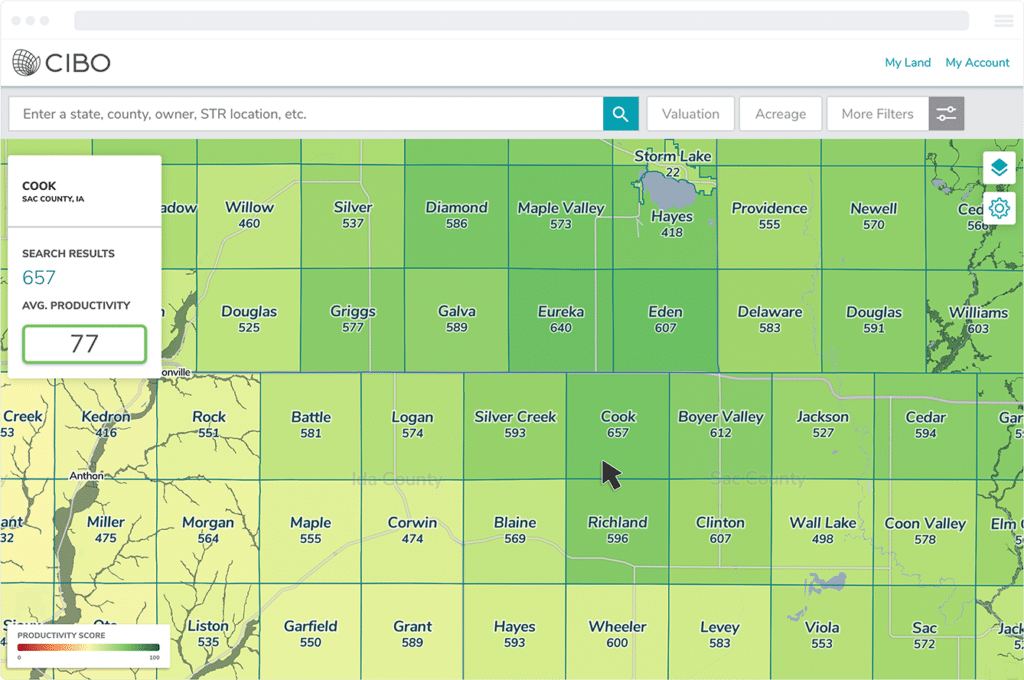
Available Layers
- Average Projected Yields: Watch yield projections change over the growing season with county average projected yield map layers. Track corn, soy and cotton projections in the geographies you care about most.
- Proprietary CIBO Scores: Explore our estimated lease values, valuations, and productivity scores to effectively evaluate and compare land.
- Publicly Available Information: Visualize publicly available data, such as total acreage and tillable area, to find land opportunities more efficiently.
Register for free to access our full set of interactive map layers and start exploring today.
About the Author
Laura Tramontozzi is the Consumer Experience Design Lead at CIBO Technologies, a science-driven software startup. She is a Senior Designer with over 10 years of experience, focused in the tech industry. Prior to CIBO, she worked for several firms including Seven Bridges and Carbonite. She holds a BS in Marketing from Babson College and a certificate in graphic design from the Massachusetts College of Art and Design.

