By: Adam Pasch
There has been a large push towards carbon neutrality. Many, m fany companies have announced Carbon Net Zero goals starting as early as 2030. To help companies with agriculture in the supply chain meet these goals, CIBO has created CarbonLab™, a tool for growers, advisors, and enterprises to understand the carbon footprints of a field, fields, or an entire portfolio of fields.
CIBO has leveraged our proprietary scalable software architecture to simulate the carbon footprints at scale.
How It Works
- Select a field, fields, or a portfolio (folder) of fields.
- Select Practices: Baseline and Alternate
- CIBO has five options when it comes to running CarbonLab.
- a. Regional Practices — The typical practices for crop rotation, cover crops, nitrogen application, and predominant tillage performed in the county of the field.
- b. Best Practices — The most sustainable practices for crop rotation, cover crops, no-till, and a 10% reduction in the regional normal nitrogen rates.
- c. Poor Practices — Practices that are not sustainable, such as: no cover crops, conventional tillage, and a 10% increase in the regional normal nitrogen rates.
- d. Actual Practices — The actual practices as determined by remote sensing and then replicated into the future.
- e. Custom Practices — User-defined practices for cover crop, tillage practice, and nitrogen reduction compared to normal regional normal rates.
- Click Calculate
- View Results as total tonnes of CO2 emissions and also as tonnes of CO2 emissions per acre
-
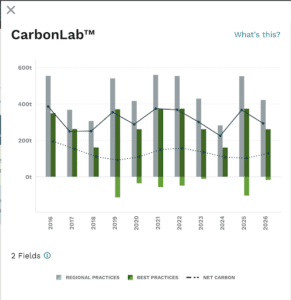
- CIBO shows a graph of the carbon footprint values for both the baseline and alternate practices for 11 years (current year, as well as five years into the future and five prior years), including the Net Carbon values.
- CIBO also shows the three components that make up the carbon footprint.
- Diesel Use: CO2 emissions related to the use of diesel fuel based on the practices selected
- CO2 Soil Flux: CO2 emissions from the soil back to the atmosphere, mostly due to weather and tillage
- N2O Soil Flux: CO2-eq emissions from the soil due to nitrogen application
Understanding the delta between the Baseline and Alternate carbon footprints (i.e., the approximate potential carbon credit)
The different deltas can be used to understand the potential impacts of different practices on the land being analyzed. The three different types of deltas are:
- Carbon Maximum (Actual Practices → Best Practices): This difference describes the amount of potential carbon footprint reduction a farmer could expect by adopting all best management practices above and beyond current practices. This value is the remaining carbon impact available to the farmer.
- Regenerative Potential (Regional Practices → Best Practices): This difference describes the amount of potential carbon footprint reduction available to the average farmer in a region, assuming the farmer adopts all the best management practices.
- Carbon Impact (Regional Practices → Actual Practices): This difference describes how much higher or lower a farmer’s footprint is compared to the regional average carbon footprint.
Additionally, CarbonLab offers the ability to create ‘Custom Practices’ where a user can specify cover crops, tillage, and nitrogen reduction, which will be applied to all fields that were selected for processing in CarbonLab.
Example: Set of Fields
-
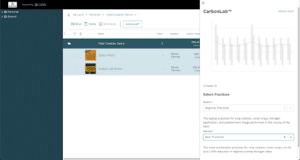
- Select two fields from Land Manager
- Click on CarbonLab
- Select Regional Practices for Baseline
- Select Best Practices for Alternate
- Click Calculate Carbon Footprint
- View result
a. Graph of yearly footprints
b. Tables with details for the Carbon Footprints
-
-
- Regional Practices: 368.47 tCO2 (0.79 t/acre)
- Best Practices: 157.35 tCO2 (0.34 t/acre)
-
c. Delta of the Baseline – Alternate: 211.12 tCO2 (0.45 t/acre)
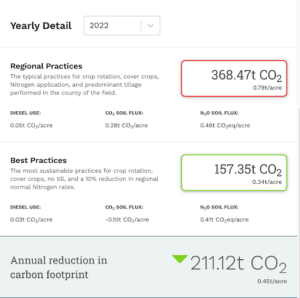
- The footprints are for a single year (2022).
- The delta is a rough approximation; more specific data requirements are required to determine the actual carbon credit amount.

