Blog
A Tale of Two Parcels
June 25, 2020
By Jason Rute
When we talk to growers, they often tell us that it’s practically impossible to truly predict future capabilities of farmland without knowing its historic performance. An analogy for the layman: imagine buying a used car with no opportunity to test drive it. At CIBO, we take this issue seriously, and we’ve invested in developing our proprietary Productivity Score based on our powerful crop simulation capabilities. This capability enables growers to develop a more granular understanding of a parcel without actually working on it.
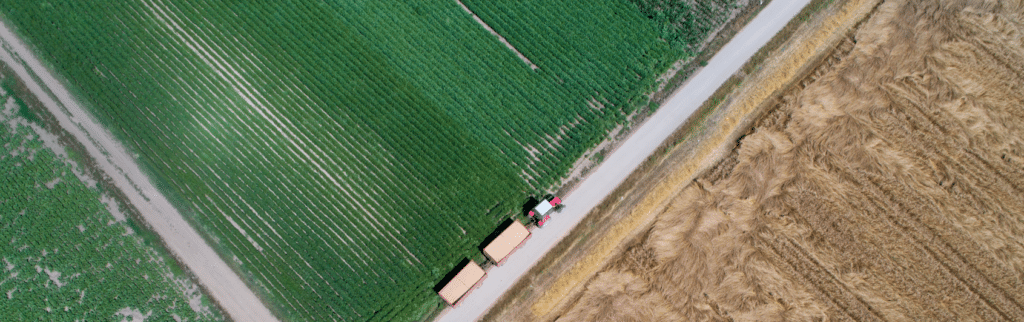
To see this situation in action, let’s look at two parcels in Bremer County, Iowa (Figure 1).
 Figure 1: Bremer County, Iowa
The first one, which we will name Parcel A, is in the southeastern corner, just outside of Waverly (Figure 2). The second one, Parcel B, is along the southern edge of the county (Figure 3).


Figure 2: Parcel A Figure 3: Parcel B
When you pull up a report for either of these parcels in our Land Assessment Tool, you are immediately greeted with their corresponding Productivity Scores. Parcel A has a Productivity Score of 73, quite low for this part of Iowa; and Parcel B has a Productivity Score of 92, one of the highest in all of Bremer County (see the slider bar Figure 4).
Figure 4: Parcel B CIBO Productivity Score
The Making of a Productivity Score
To understand how we arrived at this score, let’s look at what is happening behind the scenes. Productivity is a measure of how well a field can support standard row crops. Productivity is determined by the complicated interactions of soil, weather, and field management. CIBO’s Productivity Score leverages our Process-Based Crop Model, which simulates all of these variables and interactions (including soil, weather, and field management) day-by-day, year-after-year in the same field.
Now, let’s briefly examine how soil, weather, and field management all play a role in our model and help us arrive at the Productivity Scores listed in the application.
Soil
Soil quality is one of the most obvious factors to look at when assessing the productivity of a field, and luckily the United States government has already done a detailed survey of the nation's soils in its SSURGO soil survey. Below, you can see the soil profiles for both fields (Figures 5 and 6), as shown in our application.

Figure 5: Parcel A Soil Figure 6: Parcel B Soil
Parcel A has sandy soils with low organic carbon, low nutrients, and lower water-holding capacity. On the other hand, parcel B is made up of loamy soils, which have high organic carbon content and good water-holding properties. Right away, this will tell us that Parcel B is probably a better parcel for growing crops, and our model does indeed take this difference into account.
Weather
Weather is another important factor in a CIBO Productivity Score. At first, it may seem that weather doesn’t matter since these two parcels are only miles apart and likely experience the same climate. We also see that each parcel has the same yearly rainfall.

Figure 7: Cumulative Precipitation Per Year (Harvest to Harvest)
But what is more important than the weather itself is the interaction between soil and weather. That is where our crop simulation capabilities give our users an upper hand. If we assume that corn is grown every year (our actual simulation is more advanced than that), then our model gives the following simulated yields for each parcel:

Figure 8: Simulated Corn Yield Over Ten Years
Notice that in some years — like 2010, 2016, and 2018 — the yields for each field are similar. Those happen to be some of the years with the most precipitation during the growing season. If every year in Iowa had weather like that, these two fields would be more similar in behavior. However, that is not always the case and weather varies greatly between years. For example, take the drought year of 2012. When we simulate corn growth for that year, we see that the yields of Parcel B significantly outperform those of Parcel A. By simulating the complex interaction of daily weather and soil, we can gain a number of insights into what is going on in the field.
Moreover, simulation gives us more flexibility than if we had access to yields for that parcel for each year. Indeed, the USDA’s Crop Data Layer information (also available in our application) shows that Parcel A grew soybeans in 2012 while Parcel B planted corn. Without simulation, we couldn’t even directly compare their yields.
Our simulation lets us dig even deeper into the agricultural capabilities of the parcels. For example, we might suspect that the water-holding capabilities of the two soils are to account for the performance differences in 2012. Our model can directly measure this with a quantity called “drought stress.” Each day in our simulation, a plant experiences a drought stress from 0 to 1. The higher the drought stress, the more the crop lacks sufficient water. This plot shows the cumulative drought stress for each parcel over the growing season.

Figure 9: Cumulative Drought Stress for Each Year
From this plot, we can see that Parcel A experiences drought stress more frequently — and more severely — than Parcel B.
Field Management Practices
The final piece of the productivity equation is management, and how a field is managed can make a large difference in the land’s productivity. Unlike soil and weather, management is a human behavior that is difficult to model at the level of an individual field. While we are continually expanding our capabilities here at CIBO to infer management practices, for now it is enough to assume that the management behaviors of nearby parcels are the same. However, just like the weather, it is vital to understand and simulate the complex interaction of management, soil, and weather. At CIBO, we have put significant effort into understanding the typical management practices for a given area of the country by combining public and industry data with the experience of skilled agronomists.
Moreover, our simulation capabilities let us play out different scenarios with management. Let’s engage in a “what-if” scenario for a moment and assume both of these parcels are irrigated — a fairly uncommon practice in this area. Then the yields would look more like the following: 
Figure 10: Simulated Corn Yield (Assuming Irrigation) Over Ten Years
According to our model, irrigation (using sufficient amounts of water) eliminates much of the differences between the two soils. The gains in Parcel B’s yields are minimal but much greater for Parcel A.
On the other end of the spectrum, we can simulate removing (or weakening) some management — let’s assume neither parcel applies nitrogen (fertilizer) to the field.

Figure 11: Simulated Corn Yield (Assuming No Nitrogen Application) Over Ten Years
Then we see an even larger difference in yield, which is consistent from year to year. The sandy soil needs nitrogen to produce well. And if we dig even deeper, we can see that — in addition to drought stress — the Parcel A field also experiences a lot of nitrogen stress.

Figure 12: Cumulative Drought and Nitrogen Stress
Summary
Using process-based modeling to create Productivity Scores opens up a number of ways to more deeply understand the land:
- First, process-based modeling provides an interpretable and plausible number for the productivity of a field;
- Secondly, it accounts for the complex interaction of soils and weather;
- Thirdly, it provides additional information on simulated yields and plant stress, simulating a range of crops; and
- Lastly, these efforts allow farmers to play out “what-if” scenarios about management that enable them to take field-specific management into account if—and when—that specific information becomes available.
At CIBO we are excited about the opportunities this work presents, and we are continuing to improve our Productivity Score methodology and the suite of information shared in our application.